
What Is Apache Kafka?
Apache Kafka is an open-source distributed event streaming platform developed by LinkedIn and later open-sourced through the Apache Software Foundation.
In simpler terms, Kafka is a system for moving data between systems, applications, or services in real time — quickly, reliably, and at massive scale.
Think of it as a central nervous system for data — where different parts of a company’s digital ecosystem send, receive, and process messages (or “events”) continuously.
Core Concepts
Let’s break down Kafka’s main building blocks:
1. Event (or Message)
An event is the basic unit of data in Kafka — something that happened and you want to record or share.
- Example:
- “User123 added item456 to cart.”
- “Sensor A reported temperature 82°F.”
Each event usually has a key, value, timestamp, and optional metadata (headers).
2. Topic
Kafka stores events in topics, which are like folders or categories for related data streams.
- Example topics:
user-signups,orders,sensor-readings. - A topic can have multiple partitions, which allow it to scale horizontally.
3. Partition
Each topic is divided into partitions, which are ordered sequences of events.
- Within a partition, events have a strict order (by offset).
- Across partitions, order is not guaranteed.
- This design makes Kafka massively parallel and scalable.
4. Producer
A producer is any application or service that writes (publishes) events to Kafka topics.
- Example: a web app that sends an “order created” event whenever a user places an order.
5. Consumer
A consumer is an application or service that reads (subscribes) to events from Kafka topics.
- Example: an analytics service that listens for “order created” events and updates dashboards in real time.
Consumers can work independently or as part of consumer groups.
6. Consumer Group
A consumer group is a set of consumers that work together to process messages from one or more topics.
- Kafka divides the partitions among consumers in the group.
- Each message is processed by exactly one consumer in the group (for load balancing).
7. Broker
A broker is a single Kafka server.
- A Kafka cluster is made up of multiple brokers that share the data load.
- Each broker stores a subset of topic partitions.
8. ZooKeeper (Legacy) / Kafka Raft (KRaft)
- ZooKeeper was used to coordinate and manage cluster metadata (like broker info, leader election, etc.).
- KRaft mode, introduced in newer Kafka versions (2.8+), replaces ZooKeeper with a built-in consensus mechanism — simpler and more robust.
How Kafka Works (Simplified Flow)
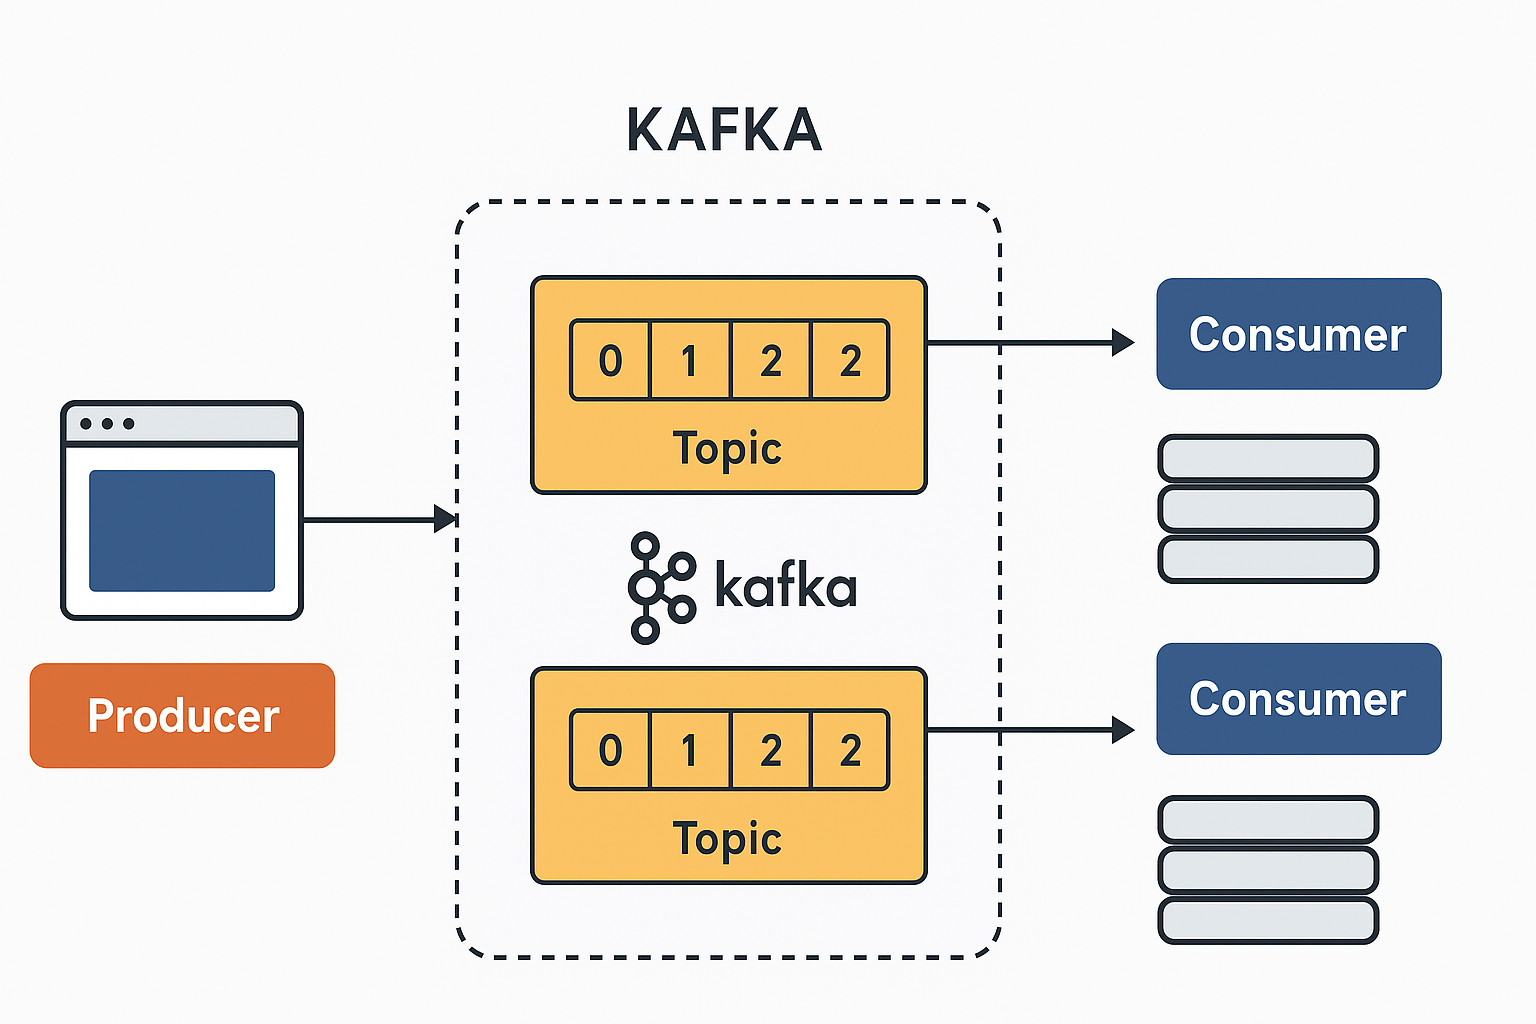
- Producer sends events → to a topic.
- Kafka stores events durably on disk, distributed across brokers and partitions.
- Consumers subscribe to topics and read events in order.
- Kafka retains data for a configurable period (even after consumption).
- This allows replays, event sourcing, and fault tolerance.
Key Features
| Feature | Description |
|---|---|
| High Throughput | Handles millions of messages per second. |
| Scalability | Add brokers or partitions with minimal downtime. |
| Durability | Data is written to disk and replicated. |
| Fault Tolerance | Automatically recovers from node failures. |
| Retention Policies | Keep data for hours, days, or indefinitely. |
| Stream Processing | Built-in APIs (Kafka Streams) for transforming data in real time. |
| Exactly-Once Semantics | Ensures no data duplication in critical pipelines. |
Kafka Ecosystem Components
- Kafka Broker – the servers that store and serve data.
- Kafka Producer – sends messages to Kafka.
- Kafka Consumer – reads messages from Kafka.
- Kafka Connect – framework for connecting Kafka to databases, files, and external systems (ETL pipelines).
- Kafka Streams – a Java library for processing and transforming data streams within Kafka.
- Schema Registry (used with Confluent Kafka) – manages message formats and versioning.
Common Use Cases
- Real-Time Analytics
- Stream website click data for dashboards and insights.
- Log Aggregation
- Collect logs from many microservices into one topic.
- Event Sourcing
- Treat every state change as an immutable event for replayability.
- Data Pipelines
- Connect databases and applications without tight coupling.
- IoT and Sensor Data
- Stream and process continuous data from devices.
- Microservice Communication
- Use events instead of REST calls to decouple services.
Analogy: Kafka as a Postal System
| Kafka Concept | Postal Analogy |
|---|---|
| Topic | Mailbox (for a certain kind of letter) |
| Partition | Sorting bins in a post office |
| Producer | Sender dropping letters |
| Consumer | Postman delivering mail |
| Broker | Post office storing and sorting letters |
| Cluster | A network of post offices |
Kafka makes sure every letter is delivered, never lost, and can be re-delivered if needed — even if a post office burns down.
Comparison with Other Systems
| System | Type | Difference from Kafka |
|---|---|---|
| RabbitMQ / ActiveMQ | Message Queue | Focus on per-message delivery; Kafka focuses on high-throughput event streaming. |
| AWS Kinesis | Managed Streaming | Similar concept, but Kafka is open-source and more flexible. |
| Redis Streams | In-Memory Stream | Faster for small use cases, but not as durable or scalable. |
| Flume / Logstash | Data Ingestion | Kafka is more general-purpose and reliable. |
Reliability and Guarantees
Kafka provides:
- At-least-once delivery (default)
- At-most-once delivery (if configured)
- Exactly-once semantics (with Kafka Streams and idempotent producers)
Data replication and leader-follower architecture ensure no data loss even if nodes fail.
Example Scenario
Using Kafka to replace Logstash in the ELK stack (log aggregation use case).
Context: Traditional Log Aggregation Using Logstash
Traditionally, the ELK stack (Elasticsearch, Logstash, Kibana) is used for centralized logging:
- Applications write logs to files.
- Logstash collects and processes those logs (possibly transforming and filtering them).
- Logstash forwards logs to Elasticsearch.
- Kibana visualizes them.
Logstash is powerful for parsing and transforming logs — but it can become:
- A bottleneck under heavy load.
- Complex to scale (it’s not a distributed system by default).
- Harder to replay or buffer logs once sent.
This is where Kafka can take over as the central log pipeline backbone.
Kafka-Based Log Aggregation ArchitectureHere’s a high-level view of how Kafka replaces Logstash:
[App Servers] → [Kafka Producers / Log Forwarders] → [Kafka Cluster] → [Consumers: Logstash Light / Kafka Connect / Elasticsearch Sink]
Step-by-Step Breakdown
1. Log Collection (Producers)
Instead of Logstash directly reading logs, you use lightweight log shippers that send log data to Kafka topics.
Common tools for this step:
- Filebeat or Fluent Bit → configured to send logs to Kafka.
- Custom Kafka producer scripts → if you want fine-grained control.
- Application-level logging appenders (like Log4j2 KafkaAppender for Java apps).
👉 Each log line or JSON log event becomes a Kafka message published to a topic, e.g., logs.webserver.access or logs.app.error.
2. Kafka Cluster (Central Log Buffer)
Kafka becomes your durable, distributed buffer for all logs.
- Logs are stored for a configurable retention period (e.g., 7 days).
- If Elasticsearch or any downstream system goes down, Kafka holds the logs until it’s back up.
- Each microservice or log type can have its own topic for organization and security.
Advantages over Logstash here:
- Kafka is horizontally scalable (just add brokers).
- Logs are replicated and persisted, so data loss is minimal.
- You can replay logs — e.g., to rebuild an Elasticsearch index.
3. Log Processing (Optional – Kafka Streams or ksqlDB)
If Logstash was doing filtering, parsing, or enrichment, Kafka offers several alternatives:
- Kafka Streams (Java API) for real-time transformation.
- ksqlDB for SQL-like log processing directly on Kafka.
- Fluent Bit / Kafka Connect Transformations for simpler enrichment.
Example:
You could extract fields (like user_id, status_code) from log lines and push structured JSON events to a new topic, e.g., logs.parsed.access.
4. Log Delivery (Consumers)
Now that Kafka holds all logs, you can send them to Elasticsearch or other systems:
Option A: Kafka Connect Elasticsearch Sink
- Use the official Elasticsearch Sink Connector from Kafka Connect.
- It automatically pulls messages from Kafka topics and indexes them into Elasticsearch.
- Scales horizontally, fault-tolerant, no custom code needed.
Option B: Lightweight Logstash
- If you still need Logstash’s grok filters or enrichment, run it in “consumer mode”.
- Logstash reads from Kafka instead of raw files:
input { kafka { bootstrap_servers => "kafka:9092" topics => ["logs.webserver.access"] } } filter { grok { match => { "message" => "%{COMMONAPACHELOG}" } } } output { elasticsearch { hosts => ["http://es:9200"] } } - This way, Logstash focuses purely on parsing, not on ingestion and buffering.
Key Advantages of Kafka Over Logstash
| Area | Logstash | Kafka |
|---|---|---|
| Scalability | Single-node process | Distributed and horizontally scalable |
| Fault Tolerance | Risk of data loss if destination fails | Retains logs durably until consumed |
| Replay Capability | Not supported | Re-process logs anytime from retained topics |
| Throughput | Moderate | Extremely high (millions of events/sec) |
| Integration | Primarily ELK | Works with many systems (DBs, Hadoop, Spark, etc.) |
| Processing | Built-in filters | Can use Kafka Streams / ksqlDB for advanced stream processing |
Example: Minimal Kafka + Filebeat + Elasticsearch Setup
1. Filebeat config (sending to Kafka):
output.kafka:
  hosts: ["kafka:9092"]
  topic: "logs.app"
  required_acks: 1
  compression: gzip
2. Kafka Connect Elasticsearch Sink:
{
  "name": "es-sink",
  "config": {
    "connector.class": "io.confluent.connect.elasticsearch.ElasticsearchSinkConnector",
    "topics": "logs.app",
    "connection.url": "http://elasticsearch:9200",
    "type.name": "_doc",
    "key.ignore": true
  }
}
This setup entirely bypasses Logstash — logs flow Filebeat → Kafka → Elasticsearch.
⚡ Optional Enhancements
- Schema Registry (Avro/Protobuf)
Define structured log formats for consistency across teams. - ksqlDB
Filter out noisy logs or aggregate error counts directly in Kafka. - Multi-Tenant Log Pipelines
Use Kafka ACLs and topic naming conventions to separate logs per team/service. - Monitoring
Use Prometheus + Grafana or Kafka’s JMX metrics for monitoring lag and throughput.
🧩 Summary Diagram
 ┌────────────────┐
 │ Application A  │────┐
 └────────────────┘    │
 ┌────────────────┐    │ Logs (JSON)
 │ Application B  │────┘
 └────────────────┘
         │
         ▼
 ┌───────────────────────┐
 │ Filebeat / Fluent Bit │ (Producer)
 └───────────────────────┘
         │
         ▼
 ┌────────────────────────────┐
 │     Kafka Cluster          │
 │  (logs.raw, logs.parsed)   │
 └────────────────────────────┘
         │
         ▼
 ┌────────────────────────────┐
 │ Kafka Connect / Logstash   │ (Consumer)
 └────────────────────────────┘
         │
         ▼
 ┌────────────────────────────┐
 │     Elasticsearch + Kibana │
 └────────────────────────────┘
Kafka Deep Dive
Let’s go deep into how Kafka topics work internally — from partitions and offsets to replication, retention, and ordering.
1. What Is a Topic, Conceptually?
A Kafka topic is a logical channel (or feed) where events of the same kind are stored and shared.
You can think of a topic as:
- A named category of messages.
- A distributed log (append-only sequence of events).
- A commit log that can be replayed by many consumers independently.
Example:
Topic: user.activity
Messages:
1. user=42, action=login
2. user=42, action=view_page
3. user=57, action=logout
Topics allow decoupling:
- Producers don’t care who reads the data.
- Consumers can read data independently, at their own pace.
2. Topic Structure and Partitions
Every topic is split into one or more partitions.
Each partition is:
- An ordered, immutable sequence of events.
- Continuously appended to by producers.
- Identified by an integer (
partition 0,partition 1, etc.).
For example:
Topic: user.activity
 ├── Partition 0 → [Msg0, Msg1, Msg2, ...]
 ├── Partition 1 → [Msg0, Msg1, Msg2, ...]
 └── Partition 2 → [Msg0, Msg1, Msg2, ...]
Why Partitions?
Partitions give Kafka its scalability and parallelism:
- Each partition can be placed on a different broker.
- Consumers in the same group can process partitions in parallel.
3. Message Offsets
Each message in a partition is assigned a unique offset — a strictly increasing number starting from 0.
Example (Partition 0):
Offset | Message
-------|----------------
0      | {"user": 42, "action": "login"}
1      | {"user": 42, "action": "view"}
2      | {"user": 42, "action": "logout"}
Offsets are crucial:
- Kafka never deletes or moves messages immediately — it just appends new ones.
- Consumers track their own offsets, so they know “where they left off.”
- Different consumers can read the same topic at different offsets, enabling independent consumption and replays.
4. Ordering Guarantees
Kafka provides ordering guarantees only within a partition, not across the whole topic.
So:
- Messages in Partition 0 will always be delivered in order: 0 → 1 → 2 → …
- But Partition 0 and Partition 1 can progress independently.
To preserve order for related messages (e.g., same user), producers often use a partition key:
partition = hash(user_id) % num_partitions
That ensures all messages for a user go to the same partition, preserving their logical order.
5. Data Replication and Reliability
Each partition is replicated across multiple brokers for fault tolerance.
For example:
Replication Factor = 3
Partition 0:
- Leader: Broker 1
- Followers: Broker 2, Broker 3
Mechanism:
- Leader handles all reads/writes.
- Followers replicate data from the leader asynchronously.
- If the leader fails, a follower is promoted to leader.
This guarantees no single point of failure and high durability.
6. Topic Retention Policies
Kafka doesn’t delete messages once they’re consumed — instead, it uses time- or size-based retention.
You can configure:
- Retention time: e.g., keep messages for 7 days.
retention.ms = 604800000 - Retention size: e.g., keep only 10 GB per partition.
retention.bytes = 10737418240
When limits are reached:
- Kafka deletes old log segments, not individual messages.
- This makes cleanup very efficient — no fragmentation.
You can also enable log compaction, which keeps only the latest value per key, useful for change logs or state synchronization.
7. Physical Storage (Log Segments)
Under the hood, each partition is stored as a series of log segment files on disk.
Example directory structure:
/kafka-logs/
  user.activity-0/
    00000000000000000000.log
    00000000000000001000.log
  user.activity-1/
    00000000000000000000.log
Each .log file stores a contiguous block of messages.
- When a segment reaches a threshold (e.g., 1 GB or 1 hour), Kafka starts a new one.
- Older segments can be deleted or compacted based on retention settings.
Because of this append-only design, Kafka achieves extremely high throughput — sequential writes are much faster than random I/O.
8. Consumers and Offsets
Consumers subscribe to topics and independently maintain offsets in a special internal topic called:
__consumer_offsets
This enables:
- Multiple consumers (or consumer groups) to process the same data without interference.
- Fault tolerance — if a consumer crashes, another can resume from the last committed offset.
Example:
- Consumer Group A has read offsets up to 1200.
- Consumer Group B is at offset 800.
Both groups are reading the same topic but at different positions.
9. Topic Lifecycle Operations
Admin tools let you control topics dynamically:
- Create:
kafka-topics.sh --create --topic logs.app --partitions 3 --replication-factor 2 --bootstrap-server localhost:9092 - Describe:
kafka-topics.sh --describe --topic logs.app --bootstrap-server localhost:9092 - Alter Retention:
kafka-configs.sh --alter --entity-type topics --entity-name logs.app --add-config retention.ms=86400000
Kafka topics are cheap to create — they’re metadata, not heavy database tables — but each partition consumes file handles and memory, so avoid thousands of partitions for small workloads.
10. Putting It All Together (Visual Model)
Topic: logs.app
 ├── Partition 0 (Leader on Broker 1)
 │     Offsets: 0 ─ 1 ─ 2 ─ 3 ─ 4
 │     Replicas: Broker 2, Broker 3
 │
 ├── Partition 1 (Leader on Broker 2)
 │     Offsets: 0 ─ 1 ─ 2 ─ 3
 │     Replicas: Broker 1, Broker 3
 │
 └── Partition 2 (Leader on Broker 3)
       Offsets: 0 ─ 1 ─ 2 ─ 3 ─ 4 ─ 5
       Replicas: Broker 1, Broker 2
Consumers:
- Group A reads all partitions (for processing).
- Group B reads subset (for monitoring).
- Each tracks its own offsets independently.
⚡ 11. Summary of Topic Mechanisms
| Mechanism | Description | Benefit |
|---|---|---|
| Partitions | Divide a topic into independent ordered logs | Scalability & parallelism |
| Offsets | Sequential message index | Enables replay and tracking |
| Replication | Multiple copies across brokers | Fault tolerance |
| Leaders/Followers | Partition leaders handle writes | High availability |
| Retention / Compaction | Time/size-based deletion or key-based compaction | Efficient storage management |
| Consumer offsets topic | Internal tracking of consumer positions | Independent replay & recovery |
| Append-only log segments | Sequential disk writes | Extremely high performance |
Example of Real-time Analytic Use Case
Apache Kafka successfully replaced a traditional real-time analytics streaming tool such as Apache Flume, Logstash, or RabbitMQ — focusing on the why, how, and what changed technically.
Overview: The Use Case
Let’s take a real-world–style scenario inspired by Uber’s or LinkedIn’s data pipelines, adapted for clarity.
Company: A large e-commerce platform (“ShopNow”).
Goal: Real-time analytics on customer behavior — clicks, searches, purchases — to feed dashboards, fraud detection, and recommendations.
Before Kafka:
They used Apache Flume + Storm + HDFS + Hive for real-time analytics.
After Kafka:
They migrated to Kafka + Kafka Streams + ksqlDB + Elasticsearch/Spark — dramatically improving speed, reliability, and scalability.
1. The Original Setup (Before Kafka)
🧱 Components:
- Flume agents running on web servers collected clickstream logs.
- Each Flume agent pushed logs into a Flume collector (a central Flume node).
- The collector sent events to:
- Storm for real-time processing.
- HDFS for long-term storage.
⚠️ Problems:
| Problem | Description |
|---|---|
| Bottlenecks | Flume’s collectors couldn’t handle traffic spikes; messages dropped under load. |
| No durability | If Storm or HDFS went down, data was lost (Flume had limited retry/buffer capacity). |
| Limited scaling | Scaling Flume required manual reconfiguration and restarts. |
| No replay | If a new analytics job needed historical data, it couldn’t “replay” past streams — they had to re-ingest from raw logs. |
| Tight coupling | Each data sink (Storm, HDFS, Spark) was tightly integrated with Flume; any change broke multiple flows. |
2. The Kafka-Based Redesign
New Architecture:
[User Clicks & Purchases]
        ↓
 [Kafka Producer SDKs / Connectors]
        ↓
      [Kafka Cluster]
        ↓
┌───────────────┬───────────────────┬─────────────────┐
│ Real-Time     │ Batch Analytics   │ Alert Systems   │
│ (ksqlDB)      │ (Spark / Flink)   │ (Kafka Streams) │ └───────────────┴───────────────────┴─────────────────┘
        ↓
 [Elasticsearch / Dashboard / S3 / ML Pipelines]
Step-by-Step Flow:
- Data Collection (Producers)
- Web servers, mobile apps, and backend APIs now send events (e.g.
click,view,purchase) directly to Kafka topics via:- REST proxy or producer libraries (Java, Python, Node.js).
- Optional ingestion connectors (e.g. Kafka Connect HTTP Source).
user.events.click user.events.purchase user.events.cart - Web servers, mobile apps, and backend APIs now send events (e.g.
- Kafka Cluster
- Kafka acts as a central event backbone.
- All events are retained for 7 days with 3x replication.
- Scaling is automatic by adding more brokers or partitions.
retention.ms=604800000 replication.factor=3 partitions=12 - Real-Time Analytics
- Instead of Storm, they now use Kafka Streams or ksqlDB:
- Aggregate and join streams in real time.
- Derive KPIs (e.g. active users, conversion rates, error rates).
- Produce derived streams like
metrics.dashboard.realtime.
CREATE STREAM user_purchases AS SELECT user_id, COUNT(*) AS total_purchases FROM user_events WHERE event_type = 'purchase' WINDOW TUMBLING (SIZE 1 MINUTE) GROUP BY user_id; - Instead of Storm, they now use Kafka Streams or ksqlDB:
- Downstream Consumers
- Kafka Connect pushes aggregated data to Elasticsearch for dashboard visualization and S3 for historical archiving.
- Machine learning services consume topics directly for fraud detection.
3. The Results
| Metric | Before (Flume + Storm) | After (Kafka Ecosystem) |
|---|---|---|
| Throughput | ~200K events/sec | > 2 million events/sec sustained |
| Data Loss | Frequent during spikes | Practically zero (due to replication & retention) |
| Latency | 5–15 seconds | < 1 second |
| Scalability | Manual reconfiguration | Automatic horizontal scaling |
| Replayability | None | Full replay supported |
| Integration | Tight coupling | Pluggable via Kafka Connect |
| Operational Overhead | High | Lower (self-balancing cluster) |
4. Why Kafka Outperformed Flume/Storm
a. Decoupling Producers and Consumers
Kafka’s publish–subscribe model lets many independent analytics systems consume the same stream without interfering.
→ One Kafka topic can feed:
- Elasticsearch for dashboards,
- Spark for ETL,
- Flink for anomaly detection,
- ML pipelines for recommendations.
b. Replay and Reprocessing
In Kafka, events are retained for days or weeks — so you can:
- Rerun analytics if downstream systems fail.
- Backfill missed data when deploying a new pipeline.
No such option existed in Flume or Storm (data was transient).
c. Unified Stream and Batch Architecture
Kafka became the single source of truth:
- Real-time consumers (Kafka Streams, Flink)
- Batch consumers (Spark, Presto, Hive)
All read from the same event logs — consistent and reliable.
d. Operational Simplification
- One scalable Kafka cluster replaced many Flume collectors.
- Connectors replaced hand-coded ingestion scripts.
- Schema Registry ensured consistent message formats.
e. Exactly-Once Processing
Kafka’s idempotent producers and transactional APIs eliminated duplicates in downstream metrics — critical for analytics accuracy.
5. Example: Real-Time Dashboard Update
Before (Flume + Storm)
- Flume → Storm → Redis → Dashboard.
- Latency 5–10 seconds.
- If Redis crashed, data was lost until Storm restarted.
After (Kafka + ksqlDB)
user.events.purchasestream in Kafka.- ksqlDB aggregates
SUM(amount)per minute. - Kafka Connect sends the results to Elasticsearch → Kibana dashboard updates in near real time (< 1 second delay).
This architecture handles millions of concurrent users without dropping events.
6. Supporting Tools in the Kafka Ecosystem
| Tool | Purpose |
|---|---|
| Kafka Connect | Integrates Kafka with databases, storage, and sinks |
| ksqlDB | SQL-based stream analytics |
| Kafka Streams | Embedded stream processing in microservices |
| Schema Registry | Manages message schemas (Avro, JSON, Protobuf) |
| Kafka REST Proxy | HTTP interface for non-native clients |
| Control Center / Prometheus | Monitoring and metrics |
7. Outcome Summary
| Impact Area | Improvement |
|---|---|
| Data Integrity | Kafka’s durable log eliminates event loss. |
| Latency | Analytics now nearly real-time (<1s). |
| Throughput | Scales linearly with brokers. |
| System Complexity | Fewer moving parts; better fault isolation. |
| Business Value | Faster insights → more accurate recommendations, reduced fraud losses. |
8. Conceptual Comparison
| Feature | Flume / Storm | Kafka Ecosystem |
|---|---|---|
| Data Flow Model | Push-based, transient | Durable, replayable log |
| Scalability | Limited | Horizontally scalable |
| Fault Tolerance | Minimal | Leader–follower replication |
| Processing Framework | Storm (custom topology) | Kafka Streams / ksqlDB |
| Storage | In-memory / ephemeral | Persistent, configurable retention |
| Reprocessing | No | Yes |
| Integration | Manual | via Connectors & APIs |
9. Real-World Example References
- LinkedIn: Migrated from custom ETL and messaging systems to Kafka for all activity streams (the birthplace of Kafka itself).
- Netflix: Replaced SQS-based pipelines with Kafka for near-real-time data movement across microservices.
- Airbnb: Moved from RabbitMQ to Kafka for scalable event analytics and user-tracking.
- Uber: Replaced Flume pipelines with Kafka + Flink + Hive for unified event streaming.
Apache Kafka vs Kinesis & Logstash
Detail comparison of Kafka vs Kinesis & Logstash and how we would replace Logstash with Kafka.
1) Short summary
- Apache Kafka — a distributed, durable, high-throughput event streaming platform (append-only log) designed for scalable pub/sub, storage, replay, and stream processing.
- Amazon Kinesis — AWS’s managed streaming platform (several services: Data Streams, Firehose, Data Analytics), optimized for easy AWS-native ingestion and managed scaling but with some platform constraints vs self-managed Kafka.
- Logstash — a data-collection/processing agent (part of the Elastic Stack) whose primary role is ingestion, parsing/transforming, and forwarding (not a clustered durable log store). Elastic+1
2) Architectural roles & mental model
Kafka = durable distributed commit log (topics → partitions → offsets). Producers append; consumers read at their own pace; data is retained for configured time/space. Kafka is the backbone for event-driven architectures and long-lived streams. instaclustr.medium.com
Kinesis = managed streaming service. Two common patterns:
- Kinesis Data Streams — stream storage with shards (you manage shard count). Supports replay and up to 365-day retention for an added cost.
- Kinesis Data Firehose (Data Firehose) — fully managed delivery to sinks (S3, OpenSearch, Redshift); no long-term replay (it’s delivery-focused). Jayendra’s Cloud Certification Blog+1
Logstash = ETL / pipeline agent. It’s an ingestion/processing node: inputs → filters (grok, mutate) → outputs. It can buffer to disk per node but is not a cluster-aware durable log store; losing a node’s local persistent queue can lose data if not architected for replication. Use Logstash to parse/enrich and forward, not as a central durable streaming backbone. Elastic+1
3) Guarantees: ordering, delivery, exactly-once
- Ordering
- Kafka: ordering guaranteed per partition (within partition offsets are strictly ordered). Use partition keys to preserve order for a key.
- Kinesis Data Streams: ordering per shard (similar partition concept). Firehose does not provide fine-grained ordering guarantees for buffering/transformation. instaclustr.medium.com+1
- Logstash: no ordering guarantees across multiple Logstash instances; order only as the pipeline processes messages.
- Delivery semantics
- Kafka: supports at-least-once by default; exactly-once semantics are available when using idempotent producers + transactions + Kafka Streams (careful design required). AWS Documentation+1
- Kinesis Data Streams: at-least-once delivery for consumers, with de-duplication your responsibility. Enhanced Fan-Out lowers latencies and helps multiple consumers.
- Logstash: acts as a forwarder; delivery semantics depend on the input/output plugins and downstream sinks. It can drop data if outputs fail unless persistent queues or external buffers are used.
4) Retention & replay
- Kafka: configurable retention (time- or size-based) per topic; supports log compaction (keep latest per key). Replays are first-class — consumers can rewind offsets and reprocess. This is why Kafka is widely used for reprocessing/backfill.
- Kinesis Data Streams: default retention is 24 hours; you can increase to 7 days or up to 365 days (paid option) — supports replay within retention window. Kinesis Firehose: no stream retention (designed to deliver to sinks). Jayendra’s Cloud Certification Blog+1
- Logstash: ephemeral forwarding; per-node persistent queues are possible (disk buffer), but they are node-local and not a distributed log — not suitable for replay across cluster without external durable store (e.g., Kafka, S3). Elastic
5) Throughput, latency & scaling
- Kafka
- Extremely high throughput (millions events/sec with proper partitioning & hardware).
- Scales horizontally by adding brokers and more partitions.
- Low latency (sub-second) for typical deployments; tuning and network/disk matter.
- Requires cluster management (zookeeper historically; KRaft newer metadata quorum mode). instaclustr.medium.com
- Kinesis
- Managed scaling model via shards (each shard has a fixed read/write capacity). Scaling requires adding/removing shards (can be manual or auto-scaling with Application Auto Scaling). Latency low (tens to hundreds ms for Data Streams; Firehose has buffering delays). Good for AWS-native workloads. Jayendra’s Cloud Certification Blog+1
- Logstash
- Scales by running more Logstash instances; not a distributed stateful store. Throughput depends on how many nodes, plugins, and filter complexity. Logstash is CPU-heavy with complex grok filters — it can be a bottleneck at very high ingest rates unless sharded and tuned. Elastic
6) Processing & stream transforms
- Kafka ecosystem: Kafka Streams (Java library), ksqlDB (SQL-like stream processing), Kafka Connect (pluggable connectors), and a rich ecosystem (Flink, Spark, Beam) — great for in-stream aggregation, joins, enrichment, exactly-once processing patterns. This turns Kafka into both transport and compute backbone. instaclustr.medium.com
- Kinesis: Kinesis Data Analytics (managed Flink) for stream processing; consumer apps (on EC2, Lambda) can process streams. Less ecosystem breadth outside AWS than Kafka’s ecosystem, but fully managed Flink gives strong streaming capabilities. Tutorials Dojo+1
- Logstash: built-in parsing & enrichment (filters) — excellent for ETL of logs and ad-hoc transformations; not intended for complex stateful streaming joins or low-latency windowed analytics at very high scale. Often used before or after Kafka (e.g., Logstash as a consumer of Kafka to parse/enrich and index into Elasticsearch). Baeldung on Kotlin
7) Integrations & ecosystem
- Kafka: huge ecosystem — Kafka Connect connectors (many sinks/sources), Confluent ecosystem (Schema Registry, Control Center), third-party tooling, and multi-cloud/on-prem options. Kafka is language-agnostic via client libraries. instaclustr.medium.com
- Kinesis: tight AWS integrations — IAM, CloudWatch, S3, OpenSearch Service, Lambda, Kinesis Firehose, Glue, Redshift, Managed Flink. Great if you are on AWS; less portable outside AWS. AWS Documentation
- Logstash: native integration with Elasticsearch and Kibana; many input/output plugins (syslog, jdbc, kafka, s3, http). Good fit in ELK-based observability stacks. Elastic
8) Operations & managed options
- Kafka
- Self-managed: full control, but operational overhead (brokers, Zookeeper/KRaft, topics, partitions, monitoring).
- Managed: AWS MSK, Confluent Cloud, Aiven, Instaclustr — reduce ops but cost varies. Managed Kafka gives near parity with Kafka features including retention and transactions. instaclustr.medium.com
- Kinesis
- Fully managed by AWS (no brokers to operate). You pay for shards, PUT payload units, enhanced-fan-out consumers, or Firehose ingestion/delivery. Easier operationally if you’re AWS-centric. AWS Documentation
- Logstash
- Simple to run (single nodes or a fleet). Operational burden rises with scale and complex pipelines. Elastic Cloud offers managed Elastic Stack including Logstash-like ingestion options. Logstash is easier to stand up but harder to make highly available without careful architecture. Elastic
9) Cost model (high level)
- Kafka (self-managed): you pay for the infrastructure (VMs/instances, disks, network) and ops. Cost depends heavily on sizing and replication factor; can be efficient at very high throughput.
- Kafka (managed): pay per broker instance or usage plan (varies by provider).
- Kinesis: pay for shards, PUT payload units, enhanced fan-out consumers, Data Firehose ingestion and delivery – straightforward billing but can scale-costly at very high throughput. Kinesis simplifies ops but may be more expensive for very large workloads vs self-managed Kafka. Upsolver+1
- Logstash: cost is the instances you run + Elasticsearch storage. Simpler small-scale costs, but at massive scale Logstash instances + Elasticsearch cluster can become expensive and operationally heavy. Elastic
10) When to pick each — practical guidance
Choose Kafka when:
- You need durable retention and the ability to replay events.
- You want very high throughput and predictable scaling via partitions.
- You need a rich stream-processing ecosystem (Kafka Streams, ksqlDB, Connect).
- You need to support many independent consumers, isolation, and transactional patterns. instaclustr.medium.com
Choose Kinesis when:
- You are heavily AWS-native and want a managed experience with tight AWS integration (Lambda, S3, Redshift).
- You want to avoid broker operations and prefer an AWS-managed service, and your throughput fits the shard model.
- You accept some platform constraints in exchange for operational simplicity. AWS Documentation
Choose Logstash when:
- You primarily need a flexible log ingestion & parsing layer feeding Elasticsearch/Kibana.
- You want many input/filter plugins and a simple way to normalize log formats before indexing.
- You don’t need a distributed durable commit log or replay semantics (or will pair Logstash with Kafka for that). Elastic
11) Real migration / hybrid patterns
- Logstash → Kafka: Replace Logstash’s ingestion/transport role with Filebeat/Fluent Bit or Logstash configured to write to Kafka. Have Kafka act as central buffer/stream; then run lightweight Logstash (or Kafka Connect) as consumers that parse/enrich and write to Elasticsearch. This decouples ingestion (Kafka) from parsing (Logstash). This pattern improves scalability and replayability. Baeldung on Kotlin
- Kinesis + Kafka hybrid: Some orgs use Kinesis if they’re AWS-first but mirror critical streams into Kafka (Confluent Replicator or MirrorMaker) for multi-cloud portability. This is more complex and costlier but possible. instaclustr.medium.com
12) Short examples & configs (conceptual)
Kafka topic creation (example):
kafka-topics.sh --create --topic app.logs --partitions 12 --replication-factor 3 \
  --bootstrap-server kafka:9092
Kinesis consumer pattern (Data Streams):
- Producer: PutRecord/PutRecords API (AWS SDK)
- Consumer: KCL (Kinesis Client Library) or enhanced fan-out consumers with Kinesis Data Streams.
Logstash-to-Kafka output (snippet):
output {
  kafka {
    bootstrap_servers => "kafka:9092"
    topic_id => "app.logs"
  }
}
13) Trade-offs & gotchas (practical warnings)
- Operational complexity: Kafka gives power and flexibility at the cost of ops complexity (though managed offerings mitigate this). Kinesis lowers ops but locks you into AWS patterns and shard management.
- Partition design matters: Kafka and Kinesis both require careful partition/shard keying to avoid hot partitions; this is a frequent source of poor performance.
- Retention & storage costs: long retention in Kafka or Kinesis (365d) consumes storage — design lifecycle (hot / archive to S3) accordingly.
- Logstash local queues are not cluster-wide: relying on Logstash alone for durability can be risky at scale. Prefer using Kafka as central durable store if you need replay and strong durability. Elastic
14) Sources & recommended reading (key citations used)
- Logstash official docs — what Logstash is and features. Elastic
- AWS Kinesis whitepaper / docs — overview of Kinesis and design considerations. AWS Documentation
- AWS whitepaper / comparison table of streaming services (decision criteria: exactly-once, retention). AWS Documentation
- Comparative articles on Kafka vs Kinesis (operational and cost considerations). Estuary+1
- Community discussion & Elastic docs on Logstash vs Kafka operational differences (node-local persistent queues, clustering differences). Discuss the Elastic Stack+1
15) Bottom line / recommendation matrix (quick)
- Need durable, replayable, multi-consumer streams + stream processing → Kafka (self-managed or managed MSK/Confluent).
- Need fully-managed AWS-native ingestion with simple integration into AWS analytics → Kinesis (Data Streams/Firehose).
- Need a flexible log ingestion + parsing agent that feeds Elasticsearch/Kibana → Logstash (or Filebeat/Fluent Bit + Kafka if you need durability).
Migration plan — Logstash → Kafka (Filebeat / OpenTelemetry Collector / Logstash → Kafka → Elasticsearch)
Below is a concrete, ready-to-run plan with exact config snippets, orchestration steps, validation tests, and operational notes. It assumes you’ll keep Logstash in the short term as a consumer/parsing layer (Logstash reads from Kafka and writes to Elasticsearch). Later you can replace Logstash with Kafka Connect / Kafka Streams if desired.
Summary
Replace direct Logstash ingestion with a durable Kafka ingestion backbone: producers (Filebeat + OpenTelemetry Collector) publish logs/metrics/traces to Kafka topics; Logstash consumes from Kafka, parses/enriches, and outputs to Elasticsearch. This decouples ingestion, adds buffering/replay, and makes the pipeline more resilient.
Architecture (target)
[App logs]       [Metrics / Traces]
   │                 │
 Filebeat        OpenTelemetry Collector (DaemonSet)
   │                 │
   └───> Kafka producers (to topics: logs.raw, metrics.raw, traces.raw) ─────┐
                                                                          │
                                                       [Kafka Cluster (topics)]
                                                                          │
                                            ┌─────────────────────────────┴─────────────────────────┐
                                            │   Stream processing layer (ksqlDB / Kafka Streams)     │
                                            │   OPTIONAL: derive observability.metrics.derived      │
                                            └─────────────────────────────┬─────────────────────────┘
                                                                          │
                                                                Logstash (consumer, parsing/enrichment)
                                                                          │
                                                           Elasticsearch (indices: logs-*, metrics-*, traces-*)
                                                                          │
                                                                      Kibana / Grafana
Prerequisites & assumptions
- Kafka cluster reachable by producers & consumers (3+ brokers recommended for production).
- Zookeeper or KRaft metadata mode depending on your Kafka version.
- Elasticsearch cluster available.
- Filebeat and OpenTelemetry Collector as DaemonSets on Kubernetes (or installed on hosts).
- Logstash installed (can be on Kubernetes, VMs, or as a StatefulSet).
1 — Kafka topic design & creation
Suggested topics:
logs.raw— raw logs (JSON or plain-text)logs.parsed— parsed & structured logs (optional, produced by processors/Logstash)metrics.raw— raw metrics (OTLP/Prometheus mapped)traces.raw— traces (if you want to stream them via Kafka)slf.analytics— derived metrics/alerts
Recommended partitioning:
- Start with partitions = number_of_consumers * 2 (min 6–12 for medium loads).
- Use replication factor
>= 3for production.
Example topic creation (CLI):
# create logs.raw with 12 partitions, RF=3
kafka-topics.sh --bootstrap-server kafka1:9092 \
  --create --topic logs.raw --partitions 12 --replication-factor 3

# create metrics.raw
kafka-topics.sh --bootstrap-server kafka1:9092 \
  --create --topic metrics.raw --partitions 6 --replication-factor 3
2 — Producer configs
Filebeat → Kafka (hosted/Filebeat YAML snippet)
Place this in filebeat.yml (or a Filebeat ConfigMap). It publishes events as JSON to Kafka.
filebeat.inputs:
- type: log
  enabled: true
  paths:
    - /var/log/*.log
  fields:
    log_topic: "logs.raw"
  fields_under_root: true

processors:
  - add_cloud_metadata: ~

output.kafka:
  # Kafka brokers
  hosts: ["kafka1:9092", "kafka2:9092", "kafka3:9092"]
  # Use a topic per event (or static)
  topic: '%{[log_topic]}'
  partition.round_robin:
    reachable_only: false
  required_acks: 1           # or -1 for acks=all
  compression: gzip
  max_message_bytes: 1000000
  codec.json:
    # Filebeat already emits JSON event; prefix disable
    pretty: false
Best-practices for Filebeat → Kafka
- Use
topictemplating to route different logs to different topics (%{[fields.service]}). - Set
required_acks: -1(acks=all) for durability in production (trade-off: latency). - Compression (gzip/snappy) reduces network & storage costs.
- Set message key if you need ordering by key (see below).
OpenTelemetry Collector (OTel) → Kafka
Use the Kafka exporter for OTEL Collector. Example collector config (otel-collector-config.yaml):
receivers:
  otlp:
    protocols:
      http:
      grpc:

exporters:
  kafka:
    brokers: ["kafka1:9092","kafka2:9092","kafka3:9092"]
    # topic can be static or deduce from resource attributes
    topic: metrics.raw
    encoding: json_v2           # json_v2 recommended for OTLP compatibility
    # optional: sarama producer config (if using contrib kafka exporter)
    metadata:
      full: true

service:
  pipelines:
    metrics:
      receivers: [otlp]
      exporters: [kafka]
    traces:
      receivers: [otlp]
      exporters: [kafka]
Notes:
- Many OTEL Collector distributions include a Kafka exporter; if not, use the Contrib Collector with the
kafkaexporter. - Use
encoding: json_v2(orotlp_protoif supported) for easier downstream processing. - You can also export traces to
traces.rawand metrics tometrics.raw.
Producer best-practices (general)
- Set
acks=all(or required_acks: -1) for durability with replication. - Use message keys for ordering: e.g. key by
pod_namespace + pod_nameoruser_idfor logs; key byjob_idfor Slurm events. - Use compression (snappy/gzip) to reduce network/disk.
- Batch small messages to improve throughput (linger.ms, batch.size in producer library).
- Use idempotent producers if exactly-once semantics are required (producer config
enable.idempotence=true).
3 — Logstash: consumer / parse / enrich / output to Elasticsearch
Idea: keep Logstash, but change input to Kafka. This offloads ingestion to Kafka and lets Logstash focus on parsing and enrichment.
Example Logstash pipeline logstash.conf:
input {
  kafka {
    bootstrap_servers => "kafka1:9092,kafka2:9092,kafka3:9092"
    topics => ["logs.raw"]
    group_id => "logstash-logs-consumer"
    auto_offset_reset => "latest"
    consumer_threads => 4
    decorate_events => true
    # security (if using SSL/SASL):
    # security_protocol => "SSL"
    # ssl_truststore_location => "/path/to/truststore.jks"
  }
}

filter {
  # if logs are JSON already, decode
  if [message] =~ "^\{" {
    json {
      source => "message"
      target => "parsed"
      remove_field => ["message"]
    }
  }

  # example grok for Apache combined log (if plain-text)
  if [source] =~ "/var/log/apache2" {
    grok {
      match => { "parsed.request" => "%{COMBINEDAPACHELOG}" }
      overwrite => ["parsed.request"]
    }
    date {
      match => [ "timestamp", "dd/MMM/yyyy:HH:mm:ss Z" ]
      target => "@timestamp"
    }
  }

  # add Kubernetes metadata if not present
  if [kubernetes] {
    mutate { add_field => { "k8s_namespace" => "%{[kubernetes][namespace]}" } }
  }

  # GeoIP enrichment example (if IP present)
  if [parsed][clientip] {
    geoip {
      source => "[parsed][clientip]"
      target => "geoip"
      add_tag => [ "geoip_lookup" ]
    }
  }

  # Normalize fields & add index routing key
  mutate {
    rename => { "parsed.level" => "log_level" }
    add_field => { "[@metadata][target_index]" => "logs-%{+YYYY.MM.dd}" }
  }
}

output {
  elasticsearch {
    hosts => ["http://es1:9200","http://es2:9200"]
    index => "%{[@metadata][target_index]}"
    # If using basic auth:
    # user => "elastic"
    # password => "changeme"
    manage_template => false
    ssl => false
    # Use pipeline for ingest node if needed
    # pipeline => "ingest-pipeline-name"
  }

  # Optional: ack back to Kafka (status topic), or write to logs.parsed
  # kafka {
  #   bootstrap_servers => "kafka1:9092"
  #   topic_id => "logs.parsed"
  #   codec => json
  # }
}
Logstash consumer notes
- Use
group_idper pipeline to enable horizontal scaling: multiple Logstash instances in same group will balance partitions among them. consumer_threadsincreases parallelism but must be tuned with partitions count.auto_offset_reset => latestfor normal operation; for initial backfill useearliestand a dedicated consumer group to read historical data.- For exactly-once semantics: Logstash Kafka input does not offer exactly-once; you should design idempotent outputs or use Kafka Streams + Kafka Connect which can be transactional.
4 — Elasticsearch index mapping & ingest pipeline
Create an index template mapping fields from parsed logs to types:
Example index template (Elasticsearch v7+):
PUT _template/logs_template
{
  "index_patterns": ["logs-*"],
  "template": {
    "settings": {
      "number_of_shards": 1,
      "number_of_replicas": 1
    },
    "mappings": {
      "properties": {
        "@timestamp": { "type": "date" },
        "log_level":  { "type": "keyword" },
        "message":    { "type": "text" },
        "k8s_namespace": { "type": "keyword" },
        "geoip": {
          "properties": {
            "country_name": { "type": "keyword" },
            "location": { "type": "geo_point" }
          }
        }
      }
    }
  }
}
Optionally create an ingest pipeline for further enrichment and use pipeline param in Logstash output if Elasticsearch ingest nodes used.
5 — Migration rollout plan (step-by-step)
- Proof-of-Concept (POC)
- Deploy a small Kafka cluster (3 brokers) in an isolated test environment.
- Deploy Filebeat & OTEL Collector to a subset of nodes (or use local producers) configured to publish to
logs.rawandmetrics.raw. - Deploy a single Logstash instance configured to consume
logs.rawand output to a test Elasticsearch cluster. - Verify end-to-end: produce log lines → appear in ES/Kibana.
- Create topics & templates
- Create
logs.rawandmetrics.rawwith appropriate partitions & RF as per above. - Create ES index templates/mappings.
- Create
- Dual-writing (safe parallel run)
- Configure Filebeat (or your apps) to write simultaneously to:
- Existing Logstash ingest (current pipeline), AND
- Kafka topic (new pipeline).
- This allows comparing outputs without traffic interruption.
- Configure Filebeat (or your apps) to write simultaneously to:
- Backfill historical data (if needed)
- If you need to reindex historical logs into Kafka, use a replayer script that reads files and publishes to
logs.rawwith original timestamps preserved (@timestampin message).
- If you need to reindex historical logs into Kafka, use a replayer script that reads files and publishes to
- Gradual cutover
- Start consuming from Kafka with a Logstash consumer group dedicated to the new pipeline.
- Monitor parity: check metrics (counts per minute, error rates) between old pipeline and new pipeline for several hours/days.
- Once parity is acceptable, point consumers (Kibana dashboards, downstream systems) to the new ES indices produced by Kafka → Logstash path.
- Decommission old Logstash ingestion
- Remove the legacy Logstash collector (or stop direct writes).
- Keep Logstash consumer reading from Kafka for parsing; or replace Logstash with Kafka Connect if desired.
- Tuning & scaling
- Add partitions / brokers if consumer lag grows.
- Monitor consumer lag (
kafka-consumer-groups.sh --describe) and adjust resources. - Tune Logstash workers, pipeline workers, and JVM memory.
- Long-term improvements
- Replace Logstash with Kafka Connect + Ingest pipelines if you want simpler, stateless consumers.
- Introduce Schema Registry + Avro/Protobuf for strict schema validation.
- Add stream processing (ksqlDB / Kafka Streams) to produce
logs.parsedso Logstash can be simplified or removed.
6 — Validation & testing checklist
- End-to-end functional tests:
- Send sample logs → verify they land in
logs.rawtopic (kafka-console-consumer). - Verify Logstash reads topic and writes to ES (check indices).
- Send sample logs → verify they land in
- Data parity tests:
- Compare counts per minute between legacy Logstash pipeline and new Kafka path for at least 24 hours.
- Failure injection tests:
- Bring down Elasticsearch; verify Kafka retains messages and Logstash/Connect can resume and process once ES is back.
- Restart Kafka broker(s); verify replication and no data loss.
- Replay test:
- Reset Logstash consumer group offsets to earliest and reprocess a slice of data to verify replay works.
- Performance & load tests:
- Run publisher at expected peak (and 2x) and measure end-to-end latency and consumer lag.
7 — Monitoring & Ops (what to watch)
- Kafka:
- Broker metrics: under-replicated-partitions, offline-partitions, controller status.
- Consumer lag per topic/consumer-group.
- Broker disk usage, IO wait.
- Logstash:
- Pipeline throughput, JVM heap usage, pipeline worker utilization.
- Elasticsearch:
- Indexing rate, search latency, cluster health (yellow/red).
- Producers:
- Filebeat/OTel collector errors, backpressure warnings.
- Alerts:
- Consumer lag > configured threshold.
- Under-replicated partitions > 0.
- ES indexing failures.
Suggested tooling: Prometheus + Grafana for Kafka/Logstash/Elasticsearch; Confluent Control Center or Burrow for consumer lag monitoring.
8 — Operational considerations & gotchas
- Partition key design: pick keys that avoid hot partitions. For logs, key by
pod_namespace+pod_nameorservice_name; for user events, key byuser_id. If no ordering required, round-robin is fine. - Topic count & partition limits: partitions consume resources (file handles, memory). Avoid creating thousands of tiny partitions.
- Retention & storage: set retention to hold data long enough for downstream recovery (e.g., 7 days). Archive to S3 for long-term storage if needed.
- Schema management: use Schema Registry (Confluent) or document schema conventions for JSON events to avoid later breakage. Consider Avro/Protobuf for stronger typing.
- Idempotency: Logstash → Elasticsearch is not transactional. For dedup needs, include a unique event ID and use ES upsert patterns or use Kafka Connect with exactly-once semantics where possible.
- Security: enable SSL (TLS) + SASL for Kafka; secure ES with TLS and auth. Use ACLs for Kafka topics to isolate producers/consumers.
9 — Example commands for troubleshooting / testing
Consume from topic:
kafka-console-consumer.sh --bootstrap-server kafka1:9092 --topic logs.raw --from-beginning --max-messages 10
Describe consumer group (lag):
kafka-consumer-groups.sh --bootstrap-server kafka1:9092 --describe --group logstash-logs-consumer
Reset offsets for reprocessing (careful!):
kafka-consumer-groups.sh --bootstrap-server kafka1:9092 \
  --group logstash-logs-consumer --topic logs.raw --reset-offsets --to-earliest --execute
10 — Example timeline & resources estimate (minimal)
- POC (1 week): small Kafka (3 brokers), OTEL + Filebeat → Kafka → Logstash → ES; run tests.
- Pilot (2–4 weeks): run dual-writing, monitor parity, tune partitioning and parsing.
- Cutover (1 week): switch traffic, monitor intensively.
- Decommission + optimization (2–4 weeks): remove legacy ingest, add schema registry, consider replacing Logstash.
Staffing: 1–2 engineers familiar with Kafka/ELK; operations support for cluster orchestration.