
Prometheus is an open-source monitoring and alerting system built for reliability, scalability, and flexibility — particularly in cloud-native and microservices environments such as those orchestrated by Kubernetes. It is part of the Cloud Native Computing Foundation (CNCF) ecosystem and is widely used for metrics-based observability.
Below is a detailed description of the Prometheus architecture, components, data model, alerting system, and integrations — especially how it is used for event monitoring and alerting.
1. Core Concept: Metrics-Based Monitoring
Prometheus focuses on metrics, not logs or traces.
Metrics are time-stamped numerical data that describe the state of systems over time — e.g.:
- CPU utilization (
node_cpu_seconds_total) - HTTP request latency (
http_request_duration_seconds) - Number of running pods (
kube_pod_running_total)
Each metric has:
- Name: e.g.
http_requests_total - Labels (key-value pairs): e.g.
method="GET",status="200",instance="node1"
This structure forms a multi-dimensional time series.
2. Prometheus Architecture Overview
Prometheus is composed of several components working together:
| Component | Description |
|---|---|
| Prometheus Server | Core component responsible for scraping metrics, storing time-series data, and evaluating alert rules. |
| Exporters | Agents or services that expose metrics in Prometheus format (e.g. node_exporter, blackbox_exporter). |
| Pushgateway | Optional component for short-lived jobs that cannot be scraped directly (e.g. batch jobs). |
| Alertmanager | Handles alerts sent by Prometheus — deduplicates, groups, routes, and sends notifications (e.g. Slack, PagerDuty, email). |
| Service Discovery | Automatically discovers targets via Kubernetes, Consul, EC2, etc. |
| Visualization Tools | Usually Grafana, which queries Prometheus via PromQL for dashboards. |
3. How Prometheus Collects Data (Pull Model)
Prometheus pulls metrics from monitored targets via HTTP on a configurable interval.
Each target exposes a /metrics endpoint returning plaintext data like:
# HELP http_requests_total The total number of HTTP requests
# TYPE http_requests_total counter
http_requests_total{method="GET", status="200"} 12345
http_requests_total{method="POST", status="500"} 42
Prometheus scrapes these endpoints at a defined interval (e.g. every 15 seconds) and stores the resulting metrics in its time-series database (TSDB).
This “pull-based model” ensures:
- Each Prometheus instance is autonomous
- Simpler debugging (you can visit
/metricsdirectly) - Better scalability and resilience (no centralized push bottleneck)
4. PromQL: The Query Language
PromQL (Prometheus Query Language) allows you to:
- Select and aggregate metrics
- Compute derived metrics
- Filter by labels
- Generate expressions for alerting or visualization
Example queries:
# Average CPU usage per node
avg(rate(node_cpu_seconds_total{mode!="idle"}[5m])) by (instance)

# Error rate for HTTP requests
rate(http_requests_total{status=~"5.."}[5m])

# Alert if high latency
histogram_quantile(0.95, rate(http_request_duration_seconds_bucket[5m]))
5. Alerting in Prometheus
Prometheus has a two-stage alerting pipeline:
(a) Alerting Rules
Defined in YAML, Prometheus periodically evaluates alert expressions (PromQL queries) and triggers alerts when conditions are met.
Example (alerts.yml):
groups:
  - name: instance-health
    rules:
      - alert: InstanceDown
        expr: up == 0
        for: 2m
        labels:
          severity: critical
        annotations:
          summary: "Instance {{ $labels.instance }} is down"
          description: "No data received from {{ $labels.instance }} for 2 minutes."
expr— PromQL expression evaluated on schedulefor— Duration the condition must be true before firinglabels— Metadata for routing and severityannotations— Human-readable info for notifications
(b) Alertmanager
When alerts fire, Prometheus sends them to the Alertmanager via HTTP.
The Alertmanager:
- Deduplicates repeating alerts
- Groups related alerts (e.g., multiple instances down in one alert)
- Silences alerts temporarily
- Routes alerts to destinations (email, Slack, PagerDuty, Opsgenie, etc.)
Example Alertmanager config (alertmanager.yml):
route:
  receiver: "slack_alerts"
  group_by: ["alertname", "cluster"]

receivers:
  - name: "slack_alerts"
    slack_configs:
      - channel: "#ops-alerts"
        send_resolved: true
6. Prometheus Time-Series Database (TSDB)
Prometheus has a built-in TSDB optimized for fast ingestion and querying:
- Data stored on local disk (default retention ~15 days)
- Supports chunk compression for efficiency
- Allows remote storage integrations (e.g., Thanos, Cortex, VictoriaMetrics) for long-term retention and scaling
7. Exporters (Metric Sources)
Prometheus itself only scrapes data — it depends on exporters to expose metrics. Common ones include:
| Exporter | Purpose |
|---|---|
| node_exporter | OS-level metrics (CPU, memory, disk, network) |
| blackbox_exporter | Endpoint probing (HTTP, TCP, ICMP) |
| cadvisor / kube-state-metrics | Kubernetes pod/node metrics |
| snmp_exporter | Network devices via SNMP |
| mysqld_exporter, postgres_exporter | Database metrics |
Custom applications can expose /metrics directly using Prometheus client libraries (Go, Python, Java, etc.).
8. Event Monitoring Use Cases
Prometheus is used for event-based monitoring where metrics change signal important state transitions or anomalies:
| Event Type | Example Metric | Possible Alert |
|---|---|---|
| Service Down | up == 0 | Instance down alert |
| High CPU/Memory | node_cpu_seconds_total, node_memory_MemAvailable_bytes | Resource exhaustion |
| Job Failure | batch_job_success_total | Job error spike |
| Network Issue | node_network_receive_errs_total | Packet loss |
| Latency Spike | http_request_duration_seconds | SLO violation |
By continuously evaluating PromQL expressions, Prometheus detects these events in real time.
9. Integrations & Visualization
Prometheus integrates tightly with:
- Grafana → Dashboards & visualization
- Kubernetes → Auto-discovery of pods/services
- Alertmanager → Notification and routing
- Thanos / Cortex / VictoriaMetrics → Long-term storage and global view
Grafana queries Prometheus to show dashboards of time-series metrics and alert statuses — ideal for NOC or SRE teams.
10. Strengths & Limitations
Strengths
- Simple and reliable architecture (no external dependencies)
- Multi-dimensional data model (labels)
- Rich query language (PromQL)
- Powerful alerting with routing and deduplication
- Excellent Kubernetes integration
- Strong ecosystem and community
Limitations
- Short-term storage (default local retention)
- Not ideal for high-cardinality data (too many unique label combinations)
- Limited support for push-based metrics (via Pushgateway workaround)
- No built-in log or trace collection (use Tempo/Loki for full observability)
Summary
Prometheus is the backbone of modern observability stacks, providing:
- Event monitoring via metrics scraping
- Powerful query-based alerting
- Flexible integrations with Grafana and Alertmanager
Together, Prometheus + Alertmanager + Grafana (the “PGA stack”) deliver a complete open-source monitoring and alerting solution that is reliable, extensible, and cloud-native.
Prometheus: internal architecture and storage model
At its core, Prometheus is a pull-based time-series database (TSDB) tightly integrated with a monitoring and alerting pipeline. Its internal design is optimized for high-ingestion, append-only workloads typical of metrics.
1) Data model and ingestion pipeline
Prometheus stores data as time series, each uniquely identified by:
- a metric name (e.g.
http_requests_total) - a set of labels (key–value pairs)
Internally, each unique label set becomes a distinct series, which has major implications for memory use (cardinality).
Ingestion flow:
- Scrape targets via HTTP (pull model)
- Parse exposition format
- Append samples to the TSDB head block
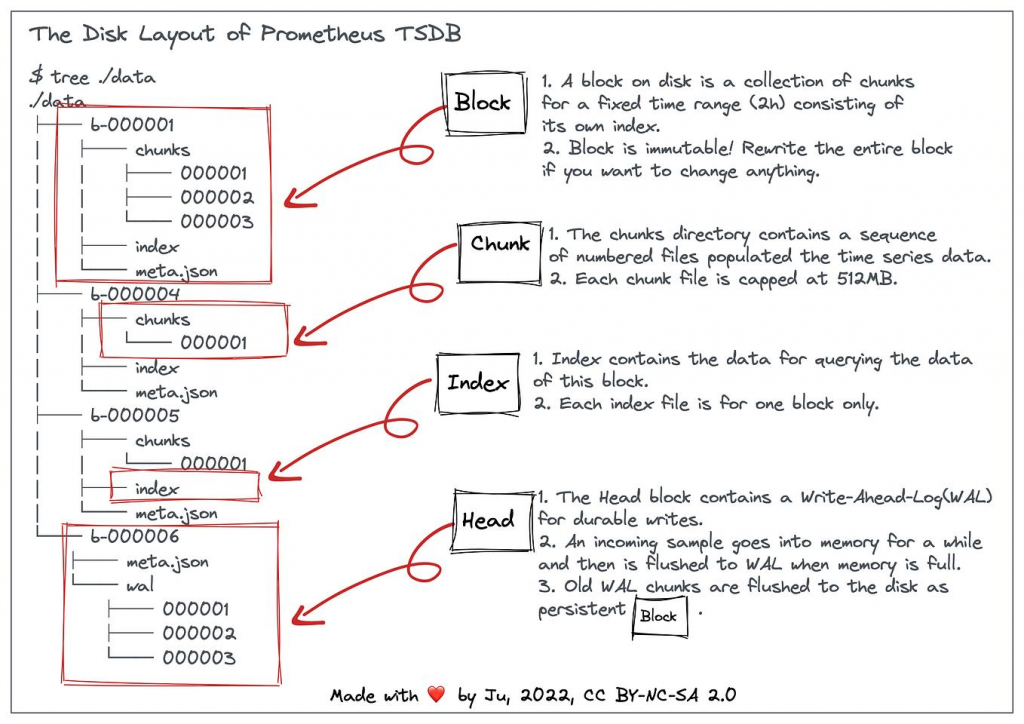
2) Storage architecture (TSDB internals)
Head block (in-memory + WAL)
- Incoming samples go to the head block, stored in memory
- Simultaneously written to a Write-Ahead Log (WAL) on disk for durability
Key properties:
- Fast writes (append-only)
- Recent data (~2 hours by default) is queryable from memory
- WAL ensures crash recovery
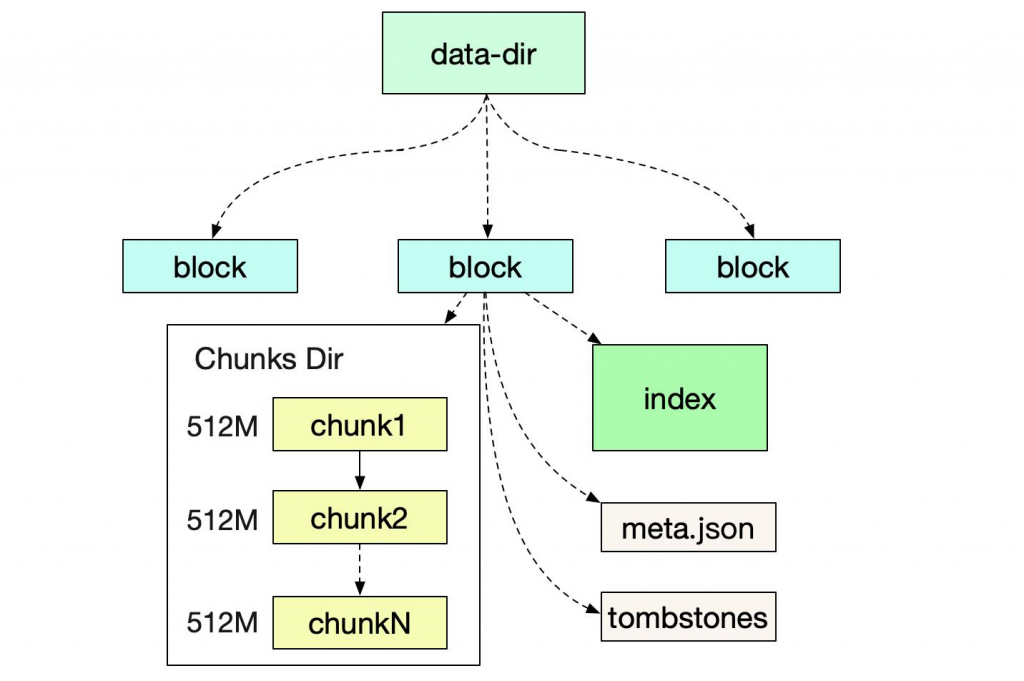
Persistent blocks (on disk)
Every ~2 hours, Prometheus:
- Compacts head data into immutable block files
- Each block contains:
- Chunks (compressed sample data)
- Index (series → chunks mapping)
- Metadata
Block hierarchy:
- 2h blocks → merged into larger blocks (e.g., 10h, then days)
Compression and encoding
Prometheus uses:
- XOR-based compression for time series values
- Delta encoding for timestamps
This yields:
- Very high compression (often ~1–2 bytes/sample)
3) Query engine (PromQL)
Prometheus executes queries using:
- A pull-based execution engine
- Chunk-level scanning
- Label-based index lookups
Strengths:
- Powerful multi-dimensional queries
- Native rate/aggregation functions
Limitations:
- Can struggle with very high cardinality or long time ranges
4) Efficiency characteristics
Strengths
- Extremely efficient for:
- Append-only writes
- Recent data queries
- Minimal dependencies (single binary)
- Good compression
Weaknesses
- Memory-heavy for high-cardinality workloads
- Local storage only (no native clustering)
- Horizontal scaling requires federation or external systems
Prometheus vs Prometheus Agent
The distinction is subtle but important: “Prometheus” (server) and “Prometheus Agent” are different operating modes of the same system, not entirely separate products.
Core idea
- Prometheus (server mode) = full monitoring system + local TSDB
- Prometheus Agent = lightweight scraper + forwarder (no long-term storage, minimal query capability)
Think of the Agent as stripping Prometheus down to just the ingestion pipeline.
1) Prometheus (server mode)
This is the “classic” deployment.
What it does
- Scrapes targets
- Stores data locally (TSDB)
- Executes PromQL queries
- Evaluates alerting rules
- Serves dashboards (via Grafana)
Architecture
Targets → Prometheus → Local TSDB → Queries / AlertsKey characteristics
- Has full TSDB (head block + WAL + blocks)
- Stores data for hours → months
- Memory-heavy (tracks all active series)
- Supports querying + alerting
2) Prometheus Agent mode
Introduced to address scaling and edge use cases.
What it does
- Scrapes targets
- Buffers briefly
- Immediately remote-writes data to another system
What it does NOT do
- No long-term local storage
- No querying (PromQL essentially disabled)
- No rule evaluation (alerts handled elsewhere)
Internal behavior differences
Storage layer
Prometheus server:
- Full TSDB:
- Head block (RAM)
- WAL (disk)
- Persistent blocks (disk)
Agent mode:
- No persistent block storage
- Minimal WAL (only for reliability during forwarding)
- Data is not kept long-term locally
Data flow comparison
Server mode
Scrape → WAL → Head block → Compaction → Disk blocks → QueryAgent mode
Scrape → Small WAL buffer → Remote write → (external TSDB)Visual intuition
Prometheus server (stateful)


Prometheus Agent (stateless-ish forwarder)


3) Why Agent mode exists
The classic Prometheus model hits limits:
Problems in large systems
- High cardinality → high RAM usage
- Many Prometheus servers → operational overhead
- Long-term storage requires add-ons (Thanos, Cortex, etc.)
Agent solves:
- Edge collection (Kubernetes nodes, remote sites)
- Lower memory footprint
- Centralized storage architectures
4) Efficiency differences
| Aspect | Prometheus Server | Prometheus Agent |
|---|---|---|
| Memory usage | High | Low |
| Disk usage | High (TSDB) | Minimal |
| Query capability | Yes | No |
| Alerting | Yes | No |
| Scalability | Limited (single node) | Highly scalable (fan-out agents) |
| Reliability | Strong local durability | Depends on remote write target |
Remote Storage Backends for Prometheus
Comparing and contrasting Prometheus remote storage backends: Thanos, Cortex, and VictoriaMetrics — focusing on architecture, scalability, long-term retention, operational complexity, and ecosystem fit.
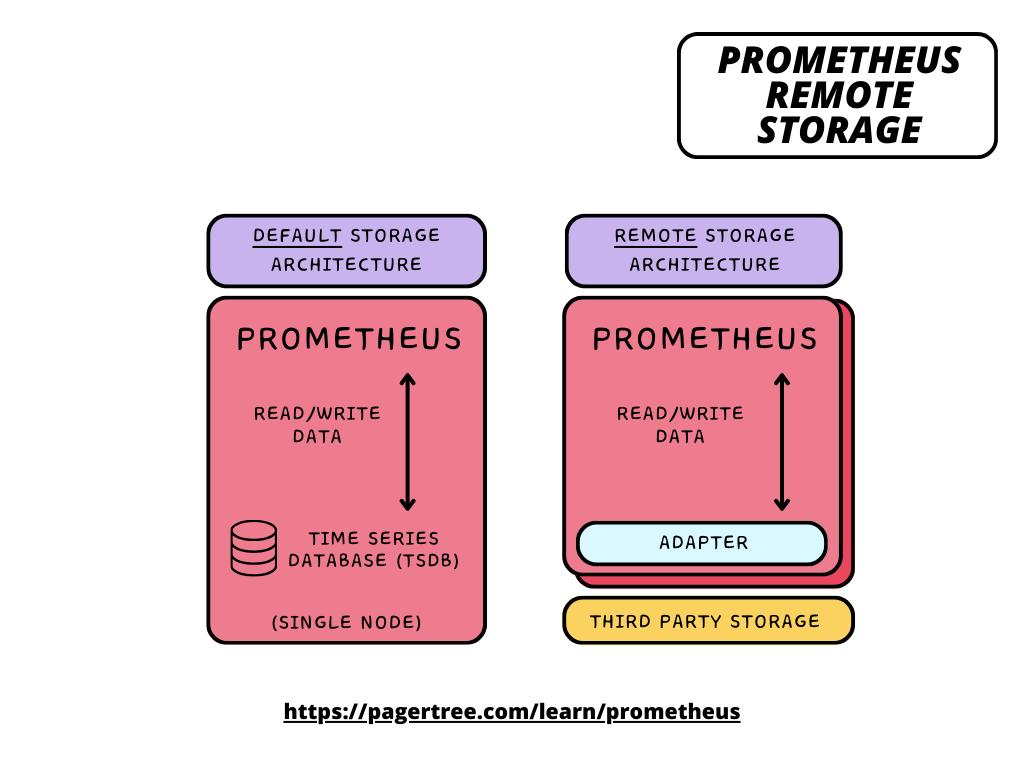
Why Remote Storage?
Prometheus by default:
- Stores metrics locally on disk.
- Retains data typically for 15 days.
- Is standalone — no horizontal scaling or global querying.
For production-grade, enterprise or AI/HPC-scale monitoring, teams need:
- Long-term metric retention (months/years)
- Cross-cluster/global querying
- High availability and scalability
- Object storage (S3/GCS/Azure Blob) for cost efficiency
That’s where Thanos, Cortex, and VictoriaMetrics come in — each extends Prometheus into a global, horizontally scalable, long-term metrics platform.
1. Thanos
Overview
Thanos is an open-source project by Improbable, now part of CNCF, that “wraps” Prometheus with additional components to achieve global, scalable, long-term storage.
It extends Prometheus using a sidecar model.
Architecture Components
| Component | Function |
|---|---|
| Sidecar | Runs next to Prometheus, uploads blocks to object storage (S3/GCS), exposes Store API for queries. |
| Store Gateway | Reads historical data from object storage and serves via gRPC. |
| Querier | Federates multiple data sources (local Prometheus, Store Gateways) and provides a unified query view. |
| Compactor | Optimizes data blocks (downsampling, deduplication). |
| Ruler | Handles alerting and recording rules globally. |
| Receive | Optional: can ingest remote write data directly (turns Thanos into a central TSDB). |
Storage
- Object storage: Amazon S3, Google Cloud Storage, Azure Blob, Ceph, MinIO, etc.
- Data retained forever at low cost.
- Compaction & downsampling for efficiency.
Strengths
- Seamless with existing Prometheus (non-intrusive, just add a sidecar)
- Cost-efficient long-term storage on object stores
- Global querying & deduplication across clusters
- Native HA Prometheus support
- Supports downsampling for faster queries on older data
Weaknesses
- Complex multi-component deployment (many moving parts)
- High operational overhead (especially Compactor, Querier, Store)
- Query latency can increase for deep historical data
- Harder to manage at massive multi-tenant scale
Best Fit
- Kubernetes-heavy environments with multiple Prometheus instances
- Organizations already using object storage (S3/GCS)
- Teams wanting 100% Prometheus compatibility and federated global view
2. Cortex
Overview
Cortex is also a CNCF project, developed originally by Weaveworks and Grafana Labs.
It aims to provide a massively scalable, multi-tenant, Prometheus-compatible metrics platform — think “Prometheus-as-a-Service”.
It uses a microservices architecture and a chunk-based storage model.
Architecture Components
Cortex splits into multiple horizontally scalable services:
| Component | Description |
|---|---|
| Distributor | Receives remote writes from Prometheus and forwards to ingesters. |
| Ingester | Writes incoming data to backend storage and handles queries for recent data. |
| Querier | Reads data from both ingesters and long-term storage. |
| Store-Gateway | (in newer architectures) for querying long-term blocks. |
| Ruler | Global alerting/rules evaluation. |
| Query-Frontend | Optional layer for caching and parallelizing queries. |
| Compactor | Merges small blocks to improve efficiency. |
Storage
Cortex stores data in object stores (S3, GCS, Azure Blob) or databases like DynamoDB, Bigtable, Cassandra, depending on the mode.
Supports two modes:
- Chunks storage (older)
- Blocks storage (Thanos-like, newer and preferred)
Strengths
- True multi-tenancy (strong isolation per tenant)
- Horizontally scalable (microservices-based)
- Integrated query caching, sharding, and parallelization
- High availability and HA Prometheus ingestion
- Enterprise-friendly; used by Grafana Cloud
Weaknesses
- Operationally heavy (many microservices)
- More complex than Thanos to run standalone
- Requires coordination of storage and caching backends
- Overhead of multi-tenancy if not needed
Best Fit
- Large SaaS providers, enterprises, or cloud observability platforms
- Multi-tenant environments (shared clusters per team/project)
- Environments needing real-time ingestion and long-term storage
- When operating at hundreds of Prometheus instances scale
3. VictoriaMetrics
Overview
VictoriaMetrics is a high-performance time-series database designed to be simpler, faster, and more resource-efficient than Prometheus + Thanos/Cortex.
It can act as:
- A drop-in remote write storage for Prometheus
- A Prometheus-compatible TSDB
- A single-binary all-in-one system (cluster or single-node mode)
Architecture Components
| Mode | Description |
|---|---|
| Single-node | Simple setup, stores all data locally, ideal for small/medium environments. |
| Cluster mode | Scalable version with vmstorage, vminsert, and vmselect components. |
| vmagent | Lightweight agent replacing Prometheus remote write or scraping. |
| vmalert | Integrated alerting component (replacement for Prometheus + Alertmanager). |
Storage
- Optimized for local disk and object storage (via snapshots/backup).
- Extremely efficient compression (10× smaller footprint than Prometheus).
- Supports multi-year retention easily.
Strengths
- Simplicity (can run as a single binary)
- Blazing-fast ingestion and queries
- Low resource consumption (RAM and CPU efficient)
- Drop-in replacement for Prometheus remote write
- Integrated alerting and scraping tools (vmalert, vmagent)
- Supports PromQL and InfluxQL
Weaknesses
- No built-in object storage integration for native block compaction (uses snapshots)
- Not officially CNCF or vendor-neutral (single-vendor project)
- Some PromQL functions differ slightly from Prometheus semantics
- Ecosystem less standardized than Thanos/Cortex
Best Fit
- Teams wanting simplicity and performance
- On-prem or hybrid environments (HPC, research clusters)
- Cost-sensitive deployments (less infra, smaller footprint)
- Self-hosted single-tenant setups
4. Comparison Table
| Feature | Thanos | Cortex | VictoriaMetrics |
|---|---|---|---|
| Project Type | CNCF (Open Source) | CNCF (Open Source) | Independent OSS (VictoriaMetrics Ltd) |
| Architecture Style | Sidecar + Components | Microservices | Monolithic (or light cluster) |
| Scalability | Horizontal (federation) | Full horizontal scale | Very efficient single-node or cluster |
| Multi-tenancy | Limited (label-based) | Native multi-tenant | Partial (via label isolation) |
| Storage Backend | Object stores (S3, GCS, etc.) | Object + DBs (S3, DynamoDB, etc.) | Local/Cloud disks (snapshots) |
| HA / Deduplication | Yes | Yes | Yes |
| Query Layer | Federated (Querier) | Parallelized (Query-Frontend) | Built-in |
| Alerting | Thanos Ruler | Cortex Ruler | vmalert |
| Operational Complexity | Moderate–High | High | Low |
| Best Use Case | Multiple Prometheus clusters | Multi-tenant cloud platform | Lightweight, high-speed self-hosted |
| Example Users | Red Hat, Grafana OSS, CNCF users | Grafana Cloud, Weaveworks | Cloudflare, GitLab, Aiven, many HPCs |
5. Summary Insight
| Need | Choose |
|---|---|
| Keep your Prometheus instances but want global long-term view | Thanos |
| Operate Prometheus as a multi-tenant SaaS platform | Cortex |
| Need simple, high-performance, low-cost storage | VictoriaMetrics |
6. Example Architectures
- Thanos: Prometheus (sidecar) → Object Storage → Thanos Querier + Compactor → Grafana
- Cortex: Prometheus (remote write) → Distributors → Ingester + Storage → Query Frontend → Grafana
- VictoriaMetrics: Prometheus (remote write) → vmstorage (cluster) → vmselect → Grafana
Conclusion
All three — Thanos, Cortex, and VictoriaMetrics — extend Prometheus for long-term, scalable, reliable metric storage.
| Simplicity → Complexity |
| VictoriaMetrics 🠒 Thanos 🠒 Cortex |
- Thanos excels for multi-cluster observability with minimal Prometheus disruption.
- Cortex suits massive, multi-tenant, SaaS-grade deployments.
- VictoriaMetrics wins on simplicity, efficiency, and performance for single-tenant or HPC-scale clusters.
Grafana Cortex/Mimir
Grafana Mimir implements long-term, horizontally scalable, multi-tenant storage for Prometheus metrics.
1. Cortex Overview
Cortex is a CNCF project (incubating) designed to run Prometheus at massive scale — providing:
- Long-term, durable storage for metrics
- Horizontal scalability (both ingestion and queries)
- True multi-tenancy (per-tenant isolation and authentication)
- Global querying across all tenants and Prometheus instances
- High availability and deduplication of metrics
Grafana Labs is the largest maintainer and operator of Cortex, which powers Grafana Cloud Metrics.
2. Architectural Overview
Cortex is microservices-based, with each component independently scalable.
It follows a write path and read path design similar to a distributed database.
Core Components
| Component | Function |
|---|---|
| Distributor | Receives time series via Prometheus remote_write API, validates, sharding, and sends to Ingester(s). |
| Ingester | Buffers and writes metrics to persistent storage (chunks or blocks). Handles recent data queries. |
| Querier | Handles read queries from Grafana or Prometheus federation. Fetches from both ingesters (recent) and object storage (historical). |
| Query Frontend | Caches and parallelizes queries for performance. |
| Compactor | Merges smaller blocks into larger ones, downsampling and optimizing storage. |
| Ruler | Evaluates alerting and recording rules at scale (multi-tenant). |
| Store Gateway | Serves data from long-term object storage to Querier (blocks mode). |
| Alertmanager | Tenant-aware alert routing. |
| Auth & API Gateway | Enforces tenant isolation and access control. |
Data Flow Summary
[Prometheus/Agent] → Distributor → Ingester → Object Store (S3/GCS/DynamoDB)
                                      ↓
                                   Querier
                                      ↓
                                   Grafana UI
3. Storage Modes
Cortex supports two main storage engines (evolved over time):
| Storage Engine | Description | Status |
|---|---|---|
| Chunks Storage | Original Cortex format using key-value stores | Legacy (deprecated) |
| Blocks Storage | Newer Thanos-like format using TSDB blocks | Current (preferred, default) |
3.1 Chunks Storage (Legacy)
- Each metric is split into chunks (typically 12-hour segments).
- Stored in NoSQL backends (e.g. DynamoDB, Bigtable, Cassandra).
- Index entries point to chunk locations.
- Allowed fast ingestion but complex querying.
Problems:
- Difficult to manage large indexes
- Expensive and slow for long-term queries
- High operational complexity (managing both chunks + index tables)
3.2 Blocks Storage (Current Standard)
Modern Cortex (and Grafana Cloud) now use Blocks Storage, modeled after Thanos’s format.
Key Concepts:
- Metrics are grouped into TSDB blocks (2-hour data windows)
- Blocks are uploaded to object storage (S3/GCS/Azure Blob)
- Each block contains:
chunks/→ actual time series dataindex→ label/value metadata for queryingmeta.json→ metadata (time range, labels, compaction level)tombstones→ deleted series
Data Lifecycle:
- Ingesters hold in-memory TSDBs (short-term buffer)
- Every 2 hours → ingester flushes a block to object storage
- Compactor merges small blocks, removes duplicates, down-samples
- Store Gateway exposes blocks via Cortex Store API
- Querier merges data from:
- Recent blocks (still in ingesters)
- Historical blocks (in object storage)
4. Multi-Tenancy & Isolation
Cortex is designed as a multi-tenant system from the ground up.
Tenant Model
- Each tenant (customer, team, environment) has a unique tenant ID
- Tenant ID is passed in HTTP header:
X-Scope-OrgID: <tenant-id> - All data in storage and memory is namespaced by tenant ID
- Authentication and rate-limiting are per tenant
Storage Isolation
- Each tenant’s blocks/chunks are stored in their own object store prefix:
s3://cortex-data/<tenant-id>/blocks/<block-id> - Queries are filtered by tenant ID to prevent cross-tenant visibility.
5. Query Path Internals
When Grafana (or Prometheus via federation) issues a query:
- Request hits Query Frontend
- Splits long-range queries into smaller time shards
- Applies caching and parallel execution
- Querier fetches:
- Fresh data from ingesters
- Historical data from Store Gateways (reading object storage)
- Results are merged, deduplicated, and returned.
Performance Features
- Query result caching (Redis, Memcached)
- Sharding and parallelism (per time range)
- Chunk and index caching (object store acceleration)
- Downsampling of historical data (via Compactor)
6. Data Storage Details
Object Storage Layer
Cortex relies on cloud-native object stores:
- AWS S3
- Google Cloud Storage
- Azure Blob Storage
- MinIO or Ceph (self-hosted)
Metadata Storage
- Cortex stores block metadata in a key-value database:
- DynamoDB, Bigtable, or Consul (depending on deployment)
- Used for block discovery and tenant indexing
7. Operational Behavior in Grafana Cloud
Grafana Cloud’s Metrics service (built on Cortex) adds:
- Centralized auth via Grafana Cloud’s identity system
- Clustered distributors and ingesters running across regions
- Compaction + retention policies per customer tier
- Replication factor 3 for HA ingestion
- Query Federation across multiple backends for global metrics
Grafana Labs operates tens of Cortex clusters, each serving thousands of tenants, with billions of active time series.
8. Scaling Characteristics
| Scaling Dimension | Cortex Behavior |
|---|---|
| Ingestion | Scale horizontally by adding Distributors/Ingesters |
| Querying | Scale horizontally by adding Queriers and Frontends |
| Storage | Object storage scales infinitely |
| Multi-tenancy | Strong isolation, per-tenant quotas, authentication |
| HA Prometheus | Deduplication based on external labels |
Cortex can handle millions of time series per second ingestion, depending on cluster sizing.
9. Comparison to Thanos
| Feature | Thanos | Cortex (Grafana) |
|---|---|---|
| Architecture | Sidecar + Components | Microservices |
| Deployment | Add-on to Prometheus | Centralized system |
| Multi-tenancy | Basic (labels) | Strong tenant isolation |
| Storage Format | TSDB blocks | TSDB blocks |
| Scaling | Federation (per Prometheus) | Horizontal (microservices) |
| Operational Complexity | Moderate | High (many components) |
| Query Performance | Good for few clusters | Excellent at large scale |
| Use Case | Multiple Prometheus clusters | SaaS metrics platform |
Grafana Labs actually contributes to both Thanos and Cortex, but:
- Grafana Cloud (Metrics) uses Cortex
- Grafana Enterprise Metrics (GEM) is based on Cortex blocks storage
10. Summary Table
| Category | Description |
|---|---|
| Data Model | Prometheus TSDB (blocks) |
| Write Path | Prometheus → Distributor → Ingester → Object Store |
| Read Path | Querier ← Ingester + Store Gateway |
| Storage Backend | Object stores (S3/GCS/Azure) |
| Index Storage | DynamoDB / Bigtable / etc. |
| Retention | Configurable (months/years) |
| Multi-Tenancy | Built-in (per-tenant isolation, quotas, auth) |
| Alerting | Cortex Ruler (multi-tenant) |
| Scaling | Horizontal for ingestion, querying, and compaction |
| Used By | Grafana Cloud Metrics, Grafana Enterprise Metrics |
11. Key Advantages in Grafana Cortex Implementation
- Multi-tenant, horizontally scalable long-term Prometheus storage
- Supports billions of active time series
- Integrated caching and query acceleration
- Full compatibility with PromQL
- Cloud-optimized (object storage, stateless microservices)
- Battle-tested in Grafana Cloud production
12. Typical Production Architecture (Grafana Cloud Example)
                   ┌───────────────────────────┐
                   │     Prometheus Agents     │
                   └────────────┬──────────────┘
                                │ (remote_write)
                                ▼
                         ┌────────────┐
                         │ Distributor│
                         └────┬───────┘
                              │ Sharded writes
                              ▼
                        ┌────────────┐
                        │ Ingester   │
                        └────┬───────┘
                             │ Flushes blocks
                             ▼
               ┌────────────────────────────────┐
               │  Object Store (S3 / GCS / etc.)│
               └────────────────────────────────┘
                             ▲
                             │
                     ┌───────┴───────────┐
                     │ Store Gateway     │
                     │ Compactor / Ruler │
                     └────────┬──────────┘
                              │
                              ▼
                        ┌────────────┐
                        │ Querier    │
                        │ + Frontend │
                        └────┬───────┘
                             │
                             ▼
                         ┌──────────┐
                         │ Grafana  │
                         └──────────┘
In summary:
Grafana’s Cortex storage implementation transforms Prometheus into a cloud-native, multi-tenant, long-term metrics platform.
It uses block-based TSDB storage in object stores, horizontally scaled microservices for ingestion and querying, and per-tenant isolation — enabling Grafana Cloud to store and query years of metrics data from millions of Prometheus series efficiently.
Compare Grafana Mimir vs VictoriaMetrics
For a 5 million+ active-series Prometheus workload and give concrete, cited estimates for performance (ingest/query), storage (1-year retention), ops complexity, and rough cloud costs.
1) Assumptions
(If your environment differs, the numbers will change; I tried to pick realistic defaults.)
- Active series: 5,000,000 (user’s request)
- Scrape interval: 15 seconds (Prometheus default; I also note differences for 60s)
- Retention: 1 year (typical LTR)
- Query load: not heavily specified — I show ingestion-side sizing and give guidance for query CPU separately.
- Cloud object-store price: Amazon S3 Standard ≈ $0.023 / GB / month (first tier) — used for storage cost calc. Grafana Labs+1
2) Raw numbers & calculations (full detail)
2.1 Sample-rate math (common intermediate)
- Seconds per year = 365 × 24 × 3600 = 31,536,000 s
- Samples per series per year @15s = 31,536,000 ÷ 15 = 2,102,400 samples / series / year.
- Total samples / year for 5M series = 5,000,000 × 2,102,400 = 10,512,000,000,000 samples / year.
(If you use 60s scrape: samples/series/year = 525,600; multiply accordingly.)
2.2 Storage — VictoriaMetrics (practical vendor numbers)
VictoriaMetrics publishes realistic compression numbers from production-like workloads: users and Managed VictoriaMetrics report ~0.4–0.6 bytes/sample for real-world metrics (node_exporter-type workloads), and Managed VM’s public benchmark shows ~0.6 bytes/sample at scale. Using that range is realistic for production data (it depends on value precision and series entropy). Medium+1
Estimates (5M series, 15s, 1 year):
- Using 0.6 bytes/sample → total bytes = 10,512,000,000,000 × 0.6 = 6.3072×10¹² bytes ≈ 5.74 TiB (~5,874 GiB).
- Using 0.5 bytes/sample → ≈ 4.78 TiB.
- Using 0.4 bytes/sample → ≈ 3.82 TiB.
(Computation shown above; I used VictoriaMetrics’ published bytes/sample values.) VictoriaMetrics+1
Monthly S3 storage cost (if you snapshot/backup that data to S3 rather than keeping local disks):
- 5.74 TiB ≈ 5,874 GiB × $0.023 ≈ $135 / month (≈ $1,620 / year) (S3 Standard first-tier rate). Amazon Web Services, Inc.
Note: VictoriaMetrics often stores data on local disks (vmstorage) and offers snapshot/backup utilities to object stores; many users keep VM on local disks (cheaper for active queries) and only archive snapshots to S3. VictoriaMetrics+1
2.3 Storage — Grafana Mimir (official Grafana sizing guidance)
Grafana’s Mimir docs provide practical capacity rules-of-thumb for object-store-backed block storage. Grafana’s store-gateway disk estimate (their documented example) is:
- 13 GB disk per 1 million active series (this is derived in their docs assuming: 2 bytes per sample for compacted blocks, 15s scrape, 1-year retention, store-gateway replication factor 3 — see Grafana doc for exact assumptions). → 13 GB / 1M series / year. Grafana Labs
Using that Grafana figure:
- For 5M active series → 13 GB × 5 = 65 GB total object-store block footprint (for 1 year retention under the doc assumptions). Grafana Labs
Monthly S3 storage cost (if you use S3 for Mimir blocks):
- 65 GB × $0.023 ≈ $1.50 / month (≈ $18 / year). Amazon Web Services, Inc.+1
Important caveat (read carefully): Grafana’s “13 GB per 1M series” estimate is based on specific* compaction/downsampling and index assumptions described in their docs** (they assume 2 bytes per sample for compacted blocks and other compression parameters). That value is much lower than raw-bytes-per-sample estimates (like VictoriaMetrics’ bytes/sample × samples/year). The discrepancy is because the two vendors use different post-compaction assumptions, index footprints, and accounting methods. In practice you should validate with your own dataset (label lengths, cardinality, histogram buckets and exemplars all change the outcome). Grafana Labs+1
3) Ingestion & CPU/memory estimates (sizing the ingestion path)
We must size how much CPU/memory to ingest the 5M series at 15s.
Samples-per-second:
- Samples/sec = active_series ÷ scrape_interval = 5,000,000 ÷ 15 ≈ 333,333 samples / second.
3.1 Grafana Mimir ingestion sizing (use Grafana guidance)
Grafana Mimir docs give component scaling rules:
- Distributor: ~1 CPU and 1 GB RAM per 25,000 samples/sec. → Distributor CPUs ≈ 333,333 ÷ 25,000 ≈ ~14 cores and ~14 GB RAM. Grafana Labs
- Ingester memory/disk: docs say ~2.5 GB RAM + 5 GB disk per 300,000 in-memory series (useful for estimating how many ingesters you need; ingesters also have replication factor). Grafana Labs
So for the ingestion path in Mimir you’d typically run dozens of cores across distributors/ingesters for 5M series (depends on replication factor and how many series are “hot” in memory), plus Store-Gateway / Compactor resources for long-term blocks. The Mimir docs also recommend running one compactor per ~20M active series (compactor sizing also consumes disk). Grafana Labs
3.2 VictoriaMetrics ingestion sizing (practical observed numbers)
VictoriaMetrics publishes practical benchmark/managed numbers:
- Managed VM benchmark: 2 vCPU + 4 GB RAM handled ~1M active series and ~211k samples/sec in their example. From that figure, scaling linearly (approx) gives for 5M series (~1.055M samples/sec) roughly ~10 vCPU + 20 GB RAM for ingestion (this is an extrapolation — VM scales well vertically and horizontally). VM also offers cluster mode (vminsert/vmstorage/vmselect) for HA and scale. VictoriaMetrics+1
VictoriaMetrics tends to need less memory per series than vanilla Prometheus and has very high single-node ingestion capability; however, for 5M series you will likely run cluster mode or beefy single-node hardware (fast NVMe). VictoriaMetrics+1
4) Query performance & sizing notes
- Mimir: Query path is microservice-based (query-frontend, querier, store-gateway). Grafana’s guidance: 1 CPU + 1 GB per ~10 queries/sec on the querier, and store-gateway CPU/memory per queries is also given. Mimir is designed to scale horizontally for large query loads and to reduce index lookups; it’s optimized for large, multi-tenant query traffic. Grafana Labs
- VictoriaMetrics: vmselect + vmstorage provide fast PromQL query responses; Managed VM examples show median query latencies of ~14 ms for certain workloads in benchmarks. In practice, VM often returns faster query latencies for many ad-hoc PromQL queries (depends on query complexity and whether you’re querying many historical blocks). VictoriaMetrics
Practical rule: if you have heavy dashboard/query workloads (many concurrent dashboards, large range queries), Mimir’s horizontal query fanout and caching may be preferable at very large multi-tenant scale; for simpler or smaller-tenant setups VM often wins for raw query latency and simplicity.
5) Operational complexity (ops) — what you’ll run & manage
Grafana Mimir
- Many services: distributors, ingesters, queriers, query-frontend, store-gateway, compactor, ruler, etc. (microservices architecture). Grafana Labs
- Requires object store (S3/GCS/Azure) for blocks + caches (memcached/Redis) for query acceleration. Grafana Labs
- More moving parts → more operational overhead (service orchestration, scaling policies, compactor tuning, caches, RBAC/tenant auth). Grafana provides production runbooks, but running at scale requires platform engineering effort. Grafana Labs+1
VictoriaMetrics
- Simple deployment options: single binary for single-node, or small set of components (vminsert, vmstorage, vmselect) in cluster mode. Fewer components to operate. VictoriaMetrics Docs+1
- Local-disk oriented (vmstorage), optional snapshot/backup to object storage — fewer spinner components like compactor/store-gateways vs. Mimir.
- Lower ops cost for one-tenant or straightforward multi-tenant needs, but if you need very strong tenant isolation at SaaS scale, you may still choose to run multiple clusters or more orchestration.
6) Cost comparison (storage + infra) — rough, order-of-magnitude
Important: these are illustrative numbers — final numbers depend on your cloud pricing, instance types, IO profile, data cardinality (label sizes), and query load. I show one retention+storage cost axis and a rough compute estimate for ingestion CPUs.
Storage (1 year retention, 5M series, 15s scrape)
- Grafana Mimir (Grafana doc estimate): ~65 GB total → S3 cost ≈ $1.5 / month (~$18 / year). Grafana Labs+1
- VictoriaMetrics (0.6 bytes/sample): ~5.74 TiB (≈ 5,874 GiB) → S3 cost ≈ $135 / month (≈ $1,620 / year). VictoriaMetrics+1
Why such a big difference? Because Grafana’s Mimir estimates reflect their block-compaction and index assumptions (their doc used 2 bytes/sample post-compaction + other factors and produced 13GB per 1M series). VictoriaMetrics reports bytes/sample numbers from real ingestion benchmarks (0.4–0.6 bytes/sample) and tends to store more raw data locally (or snapshot to object store) — different approaches to compaction/encoding and where you pay (object store vs local disk) produce the variance. Don’t treat either single number as gospel — benchmark with your data. Grafana Labs+1
Compute (ingest path) — rough cores
- Mimir distributors: ~14 cores + 14 GB RAM (based on 333k sps and 1 core per 25k sps). Add ingesters and replication overhead. Grafana Labs
- VictoriaMetrics extrapolation**: Managed example shows 2 vCPU/4GB handled 211k sps (1M series). Extrapolate to 5M → ~10 vCPU + 20 GB RAM (rough linear scaling). Use cluster mode for HA. VictoriaMetrics
Rough cloud compute cost (very approximate): if you run 10–20 vCPUs continuously (VM/EC2 instances), cost could be hundreds of $/month depending on instance types and zones; Mimir’s multi-component cluster for high availability will typically cost more in compute/ops than a compact VM setup — but Mimir’s overall storage cost (object store) can be much lower depending on the assumptions they used. You should factor the cost of S3 requests and compaction IO for Mimir as well.
7) Practical interpretation & recommendations
- If you are a SaaS provider or need strong multi-tenant isolation and global aggregation (hundreds of tenants, many queries):
- Grafana Mimir is purpose-built for this. It scales horizontally and is what Grafana Cloud / Grafana Enterprise Metrics uses in production for massive scales. Expect higher ops complexity but excellent multi-tenant controls and global querying. Grafana Labs+1
- If you are a single tenant, self-hosted, want fastest ingestion and simplest ops at lower infra/engineering overhead:
- VictoriaMetrics likely produces lower operational overhead and excellent ingestion/query performance; it also compresses very well for many real workloads (0.4–0.6 bytes/sample) so raw disk usage is low (but you must choose whether to keep data on local disks or snapshot to object storage). VictoriaMetrics+1
- Be very careful about vendor numbers:
- The Grafana Mimir “13 GB per 1M series” rule-of-thumb is explicit in Grafana’s docs and is calculated from certain compaction assumptions — but it can look “too good” compared to per-sample bytes metrics from other projects. The two approaches measure different things (compacted object-block footprint vs bytes/sample timeseries accounting). Do your own small-scale test with your actual metrics (label set, histogram buckets, exemplar use, and scrape intervals). Grafana Labs+1
- If cost is the only driver: compare
total cost = compute + storage + opsfor your workload. Mimir may save object storage costs dramatically (per Grafana doc) but will cost more in compute and ops; VM will cost more raw storage (if you send snapshots to S3) but requires less orchestration.
8) Quick TL;DR table (5M active series, 15s scrapes, 1y retention)
| Aspect | Grafana Mimir (doc-based) | VictoriaMetrics (practical benchmarks) |
|---|---|---|
| Estimated storage (1y) | ~65 GB (13 GB per 1M × 5) — Grafana doc assumptions. Grafana Labs | ~3.8–5.7 TiB (0.4–0.6 bytes/sample) → ~3.8–5.7 TiB (~3,916–5,874 GiB). Medium+1 |
| S3 storage cost (monthly) | ~$1.5 / month (~$18 / year). Amazon Web Services, Inc. | ~$135 / month (~$1,620 / year) at $0.023/GB. Amazon Web Services, Inc. |
| Ingest CPU (rough) | Distributor ~14 cores (+ ingesters/quasi many components). Grafana Labs | Extrapolated ~10 vCPU (based on 2vCPU handling 1M series @211k sps in Managed VM benchmark). VictoriaMetrics |
| Ops complexity | High — many microservices, object-store glue, caching, compactor tuning. Grafana Labs | Low–Medium — single binary or small set of services; fewer moving parts. VictoriaMetrics Docs |
| Best for | Massive multi-tenant SaaS, global queries, minimal per-tenant storage cost | High-performance single-tenant/cluster use, simple ops, efficient compression |
9) Final notes & recommended next steps
- Run a short benchmark with real data shape. I strongly recommend a 1–2 day trial ingest of a representative sample of your metrics (full label cardinality and histogram usage). That will remove uncertainty — both Mimir and VictoriaMetrics recommend testing with your real data. (Grafana provides capacity planning docs; VictoriaMetrics provides benchmark tooling.) Grafana Labs+1
- Decide where you want the cost: object storage (cheap, scalable) vs local disks (fast, but you manage disk). Mimir leans on object storage and microservices; VM is disk-first with snapshot capabilities. Grafana Labs+1
- If you want, I can produce a one-page cost model showing compute + object storage + ops estimates for your exact scrape interval, retention, and expected queries (I’ll use the same method above and you can tweak scrape/retention). I can also generate the exact commands for a 24–48h benchmark you can run (prometheus-bench or vmagent-based generator) and a small script that computes the storage/costs from the measured bytes/sample.
Sources / further reading (key items I used)
- Grafana Mimir — planning capacity & component sizing (store-gateway disk & compactor guidance). Grafana Labs
- VictoriaMetrics — Managed benchmark & bytes/sample guidance (0.6 bytes/sample example + ingestion/query results). VictoriaMetrics
- VictoriaMetrics compression discussion / real-world bytes/sample explanation. Medium
- VictoriaMetrics docs (single-node/cluster modes). VictoriaMetrics Docs
- S3 Standard pricing (used $0.023 / GB / month). Amazon Web Services, Inc.