The OpenTelemetry Collector is the central data-plane component of the OpenTelemetry ecosystem. It’s designed to receive, process, and export telemetry data (metrics, logs, traces) in a vendor-neutral way.
Think of it as a programmable observability router sitting between your applications and your backend platforms (e.g. Datadog, Grafana, Prometheus).
Core Role in an Observability Architecture
At a high level, the collector solves three problems:
- Decoupling instrumentation from backend
- Apps emit OTLP (OpenTelemetry Protocol)
- Collector handles translation/export
- You can swap backends without touching app code
- Centralized control of telemetry
- Sampling, filtering, enrichment happen in one place
- Cost + performance optimization
- Drop noisy data
- Batch and compress before sending
Internal Architecture (Pipeline Model)
The collector uses a pipeline-based architecture. Each signal type (metrics/logs/traces) has its own pipeline:
Receivers → Processors → Exporters1. Receivers (Ingress)
These ingest telemetry from various sources:
- OTLP (gRPC / HTTP)
- Prometheus scrape
- Jaeger, Zipkin
- Fluent Bit / logs
Example:
otlp→ receives traces from instrumented appsprometheus→ scrapes metrics endpoints
2. Processors (Transformation Layer)
This is where most engineering value lies.
Typical processors:
- Batch → groups data for efficiency
- Memory limiter → prevents OOM
- Attributes → add/remove labels/tags
- Sampling → reduce trace volume
- Filter → drop unwanted telemetry
Example use cases:
- Drop high-cardinality labels before Datadog ingestion
- Sample 10% of traces in production
- Add
env=prodtag globally
3. Exporters (Egress)
Send telemetry to backends:
- Datadog
- Prometheus (remote_write)
- Grafana Loki / Tempo
- OTLP (to another collector)
- Kafka
This is where vendor lock-in is abstracted away.
Deployment Modes
1. Agent (Daemon Mode)
- Runs on each host / node
- Collects local telemetry
- Low latency
Used in:
- Kubernetes DaemonSets
- VM-based workloads
2. Gateway (Central Mode)
- Centralized collectors
- Receives data from agents
Used for:
- Global sampling decisions
- Routing to multiple backends
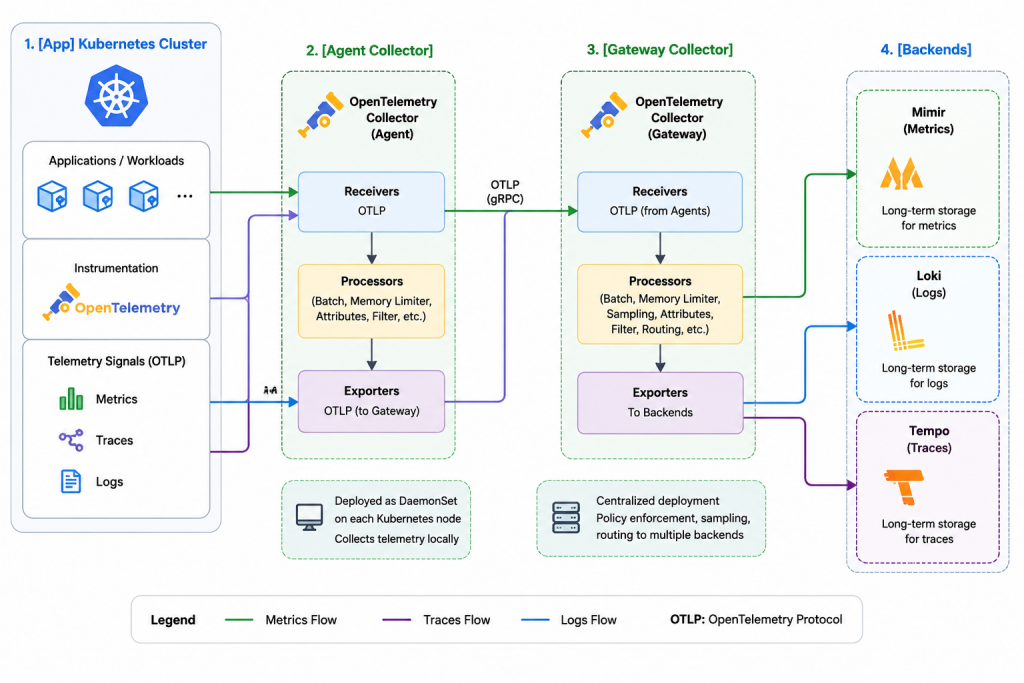
3. Hybrid (Most Common in Enterprise)
[App] → [Agent Collector] → [Gateway Collector] → [Backends]This gives:
- Local buffering + resilience
- Centralized policy enforcement
Key Capabilities (Why it’s widely adopted)
Vendor Neutrality
You instrument once → export anywhere:
- Datadog
- Grafana stack (Tempo/Loki/Mimir)
- New Relic
- Splunk
Protocol Translation
Example:
- App emits OTLP
- Collector exports to:
- Datadog API
- Prometheus format
- Kafka
Data Reduction (Critical for cost control)
- Tail-based sampling (advanced)
- Metric aggregation
- Log filtering
Observability of Observability
The collector exposes its own metrics:
- Queue length
- Dropped spans
- Export latency
This is crucial in debugging pipelines (especially in your Datadog issues earlier).
Example Minimal Config
receivers:
  otlp:
    protocols:
      grpc:
      http:

processors:
  batch:
  memory_limiter:
    limit_mib: 512

exporters:
  datadog:
    api:
      key: ${DD_API_KEY}

service:
  pipelines:
    traces:
      receivers: [otlp]
      processors: [memory_limiter, batch]
      exporters: [datadog]
Advanced Features (Enterprise Use)
Tail-Based Sampling
- Decide to keep/drop traces after seeing full trace
- Useful for:
- Keep only errors
- Keep slow requests
Multi-Destination Routing
Send:
- Full data → cheap storage (S3 / Loki)
- Sampled data → Datadog (cost control)
Load Balancing Exporters
Distribute traffic across multiple collectors or endpoints
Extensions
- Health checks
- pprof debugging
- zPages (live debugging UI)
Common Pitfalls (Relevant to your work)
Given your Datadog + GitLab context:
- Silent drops
- Caused by memory limiter or queue overflow
- Wrong pipeline wiring
- Metrics/logs/traces configured but not connected
- Exporter misconfig
- Traces disappear (exact symptom you saw)
- Sampling too aggressive
- Data “vanishes”
Mental Model
If you had to reduce it:
The OpenTelemetry Collector is a stateful, programmable telemetry proxy with buffering, transformation, and routing capabilities.