Grafana Mimir is a horizontally scalable, multi-tenant, long-term storage system for Prometheus metrics. It’s designed to handle planet-scale metric ingestion and querying—think billions of time series—while remaining compatible with the Prometheus ecosystem.
It’s effectively the evolution of Cortex (also from Grafana Labs), with stronger guarantees around scalability, reliability, and operational simplicity.
Core problem it solves
Prometheus itself is:
- Single-node
- Limited retention (local disk)
- Not ideal for multi-tenant or globally distributed systems
Mimir addresses:
- Long-term storage (object storage-backed)
- Horizontal scaling (microservices architecture)
- High availability (no single point of failure)
- Multi-tenancy (isolation between teams/orgs)
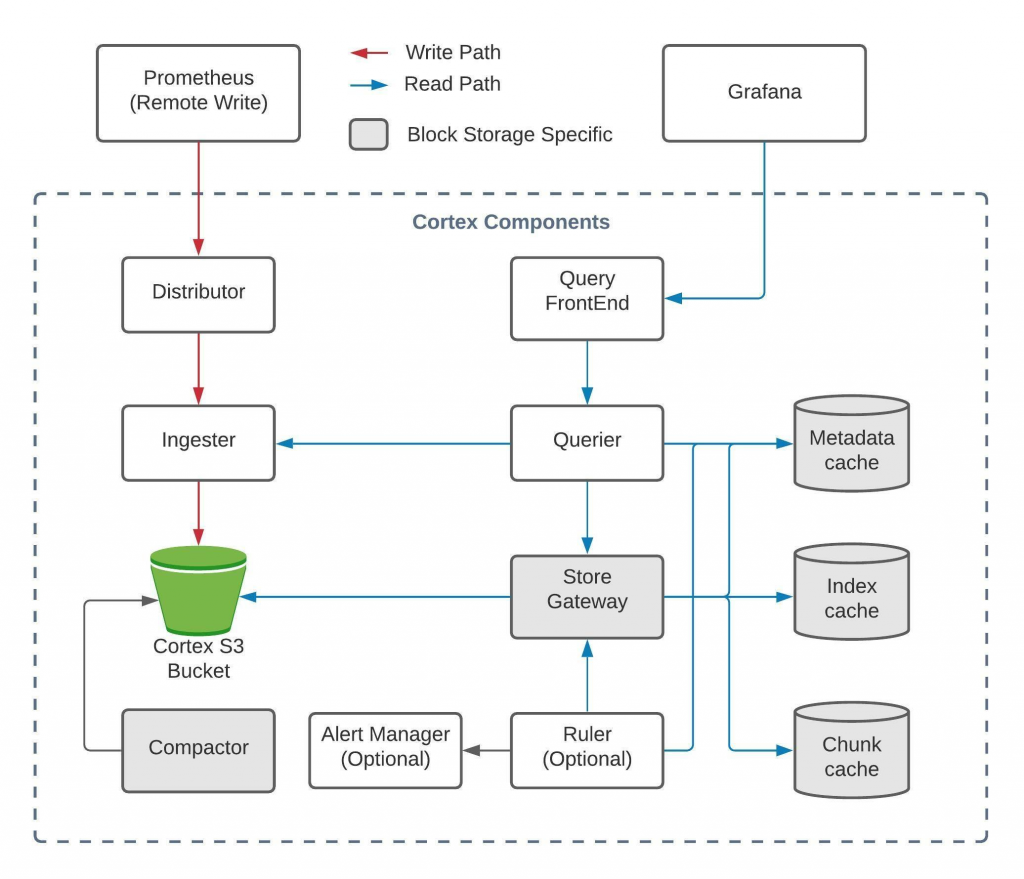
High-level architecture
Mimir is composed of multiple microservices that together implement the Prometheus remote-write/read model.
Key components
1. Distributor
- Entry point for metrics (Prometheus remote_write)
- Handles:
- Validation
- Replication
- Sharding
2. Ingester
- Writes incoming data into memory (TSDB blocks)
- Periodically flushes to object storage
- Maintains WAL (write-ahead log)
3. Object Storage (S3/GCS/Azure Blob)
- Durable, long-term storage
- Stores compressed TSDB blocks
4. Querier
- Executes PromQL queries
- Pulls data from:
- Ingesters (recent data)
- Object storage (historical data)
5. Query Frontend
- Optimizes queries:
- Splitting
- Caching
- Parallelization
6. Compactor
- Merges small blocks into larger ones
- Improves query performance
- Enforces retention
7. Ruler
- Evaluates Prometheus recording + alerting rules
8. Store Gateway
- Caches index + chunks from object storage
- Reduces latency for historical queries
Data flow (end-to-end)
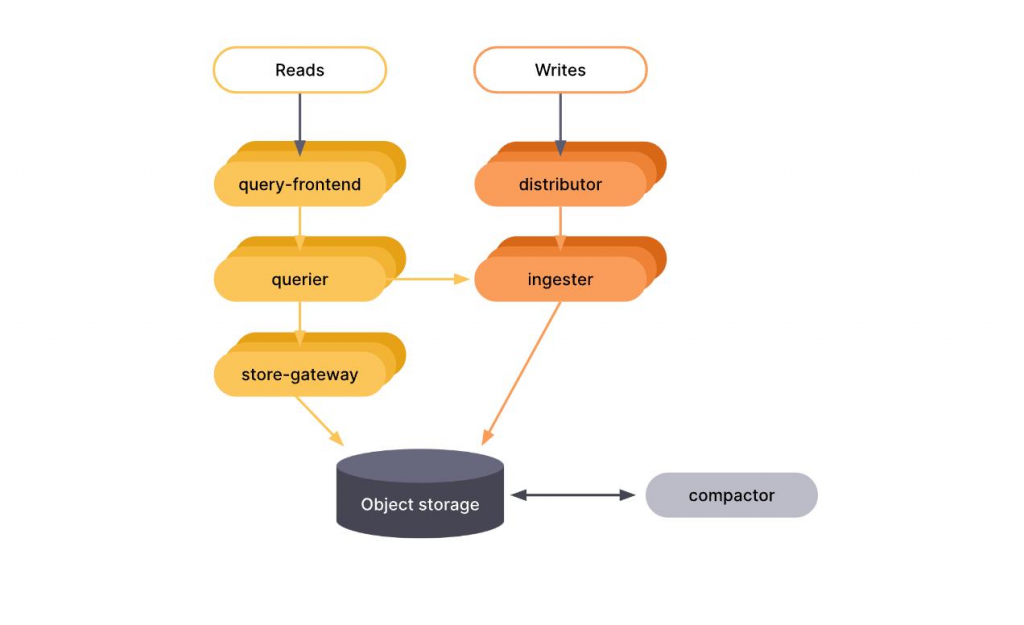
Typical pipeline:
Prometheus → remote_write → Distributor → Ingesters
                                           ↓
                                    Object Storage
                                           ↓
Query → Query Frontend → Querier → (Ingester + Store Gateway)
This is similar to the LGTM stack:
- Metrics → Mimir
- Logs → Grafana Loki
- Traces → Grafana Tempo
Storage model (TSDB under the hood)
Mimir uses a Prometheus-compatible TSDB model:
- Data stored as blocks
- Each block contains:
- Chunks (compressed samples)
- Index (label → series mapping)
Key characteristics:
- Append-only writes
- Immutable blocks once flushed
- Compaction improves efficiency over time
Multi-tenancy model
Multi-tenancy is a first-class feature:
- Each request is scoped by a tenant ID (HTTP header)
- Strong isolation:
- Separate ingestion limits
- Query limits
- Storage accounting
This is critical for:
- SaaS observability platforms
- Large enterprises with multiple teams
Scaling model
Mimir scales horizontally at every layer:
| Component | Scaling Strategy |
|---|---|
| Distributor | Stateless → scale out |
| Ingester | Stateful → consistent hashing |
| Querier | Stateless → scale out |
| Store Gateway | Cache sharding |
| Compactor | Partitioned workloads |
It uses:
- Consistent hashing ring (via memberlist or KV store)
- Replication factor (typically 3)
Performance characteristics
- Handles millions of samples/sec ingestion
- Supports billions of time series
- Query performance optimized via:
- Parallel execution
- Query splitting
- Chunk caching
Comparison vs Prometheus
| Feature | Prometheus | Mimir |
|---|---|---|
| Storage | Local disk | Object storage |
| Scalability | Vertical | Horizontal |
| Multi-tenancy | No | Yes |
| HA | Limited | Built-in |
| Retention | Limited | Long-term |
| Query | Local | Distributed |
Mimir vs alternatives
vs VictoriaMetrics
- VictoriaMetrics:
- Simpler deployment
- Very efficient compression
- Mimir:
- Better multi-tenancy
- Stronger integration with Grafana ecosystem
- More “cloud-native” architecture
vs Thanos
- Thanos:
- Extends Prometheus (sidecar model)
- Mimir:
- Fully decoupled backend
- Better for centralized, multi-tenant setups
When you’d use Mimir
Use it if you need:
- Enterprise-scale Prometheus backend
- Centralized observability platform
- Multi-cluster Kubernetes monitoring
- Long retention (months/years)
- SaaS-style tenant isolation
Operational complexity (important reality check)
Mimir is powerful, but:
- It’s not trivial to run
- Requires:
- Kubernetes (usually)
- Object storage
- Careful tuning (ingestion limits, query parallelism)
For smaller setups:
- Prometheus + remote_write → managed backend (e.g., Grafana Cloud) is often simpler
How it fits into modern observability
Typical modern stack:
OpenTelemetry / Prometheus
        ↓
Collector / Agent
        ↓
Mimir (metrics)
Loki (logs)
Tempo (traces)
        ↓
Grafana dashboards