The most important behavior of the OpenTelemetry Collector’s sending_queue during an exporter/backend outage. It focuses on how the queue behaves when the downstream observability backend (Mimir, Loki, Tempo, OTLP endpoint, Kafka, etc.) becomes unavailable.
Executive Summary
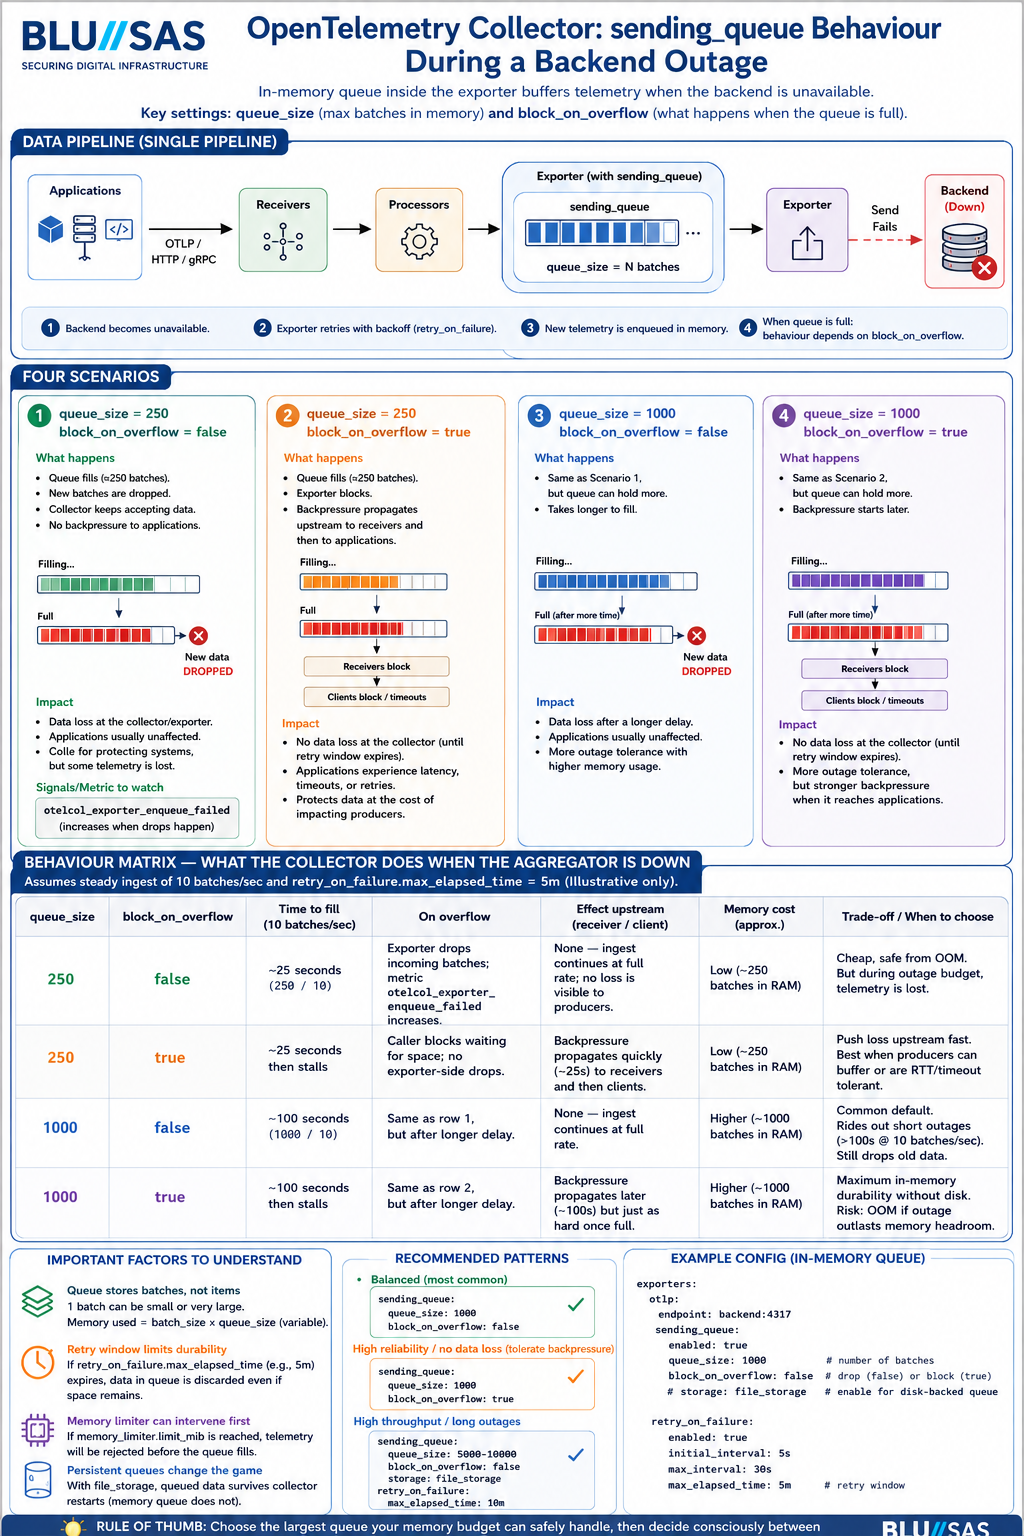
The diagram is explaining the interaction between:
exporters:
  otlp:
    endpoint: backend:4317
    sending_queue:
      enabled: true
      queue_size: 1000
      block_on_overflow: false
    retry_on_failure:
      enabled: true
      max_elapsed_time: 5m
The two key settings are:
| Setting | Meaning |
|---|---|
queue_size | Number of batches that can be buffered in memory |
block_on_overflow | What happens when queue becomes full |
When the backend is unavailable:
- Exporter retries sending.
- New telemetry accumulates in memory queue.
- Queue eventually fills.
- Collector must decide:
- Drop data (
block_on_overflow=false) - Apply backpressure (
block_on_overflow=true)
- Drop data (
Architecture Section Verification
The diagram shows:
Applications
     ↓
OTEL Receivers
     ↓
Processors
     ↓
Sending Queue
     ↓
Exporter
     ↓
     X
Backend Down
This is correct.
The queue exists inside the exporter pipeline.
Telemetry already accepted by the receiver is not immediately lost when the backend disappears.
Instead:
Receiver
   ↓
Processor
   ↓
Queue
   ↓
Exporter
   ↓
Backend
The queue temporarily absorbs the outage.
Scenario 1
queue_size=250
block_on_overflow=false
Diagram says:
Queue fills
Exporter starts dropping batches
This is correct.
Behaviour:
Backend Down
       ↓
Retry
       ↓
Queue fills
       ↓
New batches dropped
The collector continues accepting telemetry.
The application does not see a problem.
But:
Data loss occursMetrics:
otelcol_exporter_enqueue_failedstarts increasing.
Verification
Correct.
This is the safest option for cluster stability.
Many production deployments use this mode.
Scenario 2
queue_size=250
block_on_overflow=true
Diagram says:
Queue fills
Receiver blocks
Backpressure propagates upstream
Correct.
When queue is full:
Receiver
 ↓
blocked
 ↓
Client waits
Applications begin experiencing:
- OTLP timeouts
- Retries
- Increased latency
Eventually:
App
 ↓
OTLP SDK
 ↓
Timeout
 ↓
Drop
Verification
Correct.
This shifts the loss upstream rather than inside the collector.
Scenario 3
queue_size=1000
block_on_overflow=false
Diagram says:
Same behaviour as Scenario 1
but takes longer to fill
Correct.
If ingest rate is:
10 batches/secThen:
250 queue ≈ 25 sec
1000 queue ≈ 100 sec
The arithmetic shown in the diagram is correct.
Important nuance
The real duration depends on:
batch size
memory limiter
CPU
export retry interval
The infographic correctly mentions this.
Scenario 4
queue_size=1000
block_on_overflow=true
Diagram says:
Longest outage absorption
Highest memory usage
Strongest backpressure
Correct.
This gives:
More time before pressure reaches applicationsbut increases RAM consumption.
Behaviour Matrix Verification
The table at the bottom is largely accurate.
Row 1
250
false
Overflow
Drops batchesCorrect.
Upstream impact
NoneMostly correct.
Applications usually don’t notice.
Row 2
250
true
Overflow
Caller blocksCorrect.
Upstream impact
BackpressureCorrect.
Row 3
1000
false
Overflow
Same as row 1 after longer delayCorrect.
Row 4
1000
true
Overflow
Same as row 2 after longer delayCorrect.
What Is Missing?
The infographic simplifies several important production details.
1. Memory Limiter Processor
In real deployments you almost always have:
processors:
  memory_limiter:
Example:
processors:
  memory_limiter:
    limit_mib: 2048
If memory limit is reached:
Queue never reaches configured sizebecause the memory limiter starts rejecting telemetry first.
This is extremely important in Kubernetes.
2. Persistent Queues
The infographic assumes:
In-memory queue onlyModern OTEL Collector can also use persistent storage.
Example:
sending_queue:
  storage: file_storage
Then:
Memory
   +
Disk
can survive collector restarts.
Without persistent queues:
Collector Pod Restart
=
Queue Lost
3. Kubernetes Effects
For K8s SREs the important question is:
What if OTEL collector OOMs?
If queue is too large:
Backend outage
      ↓
Queue grows
      ↓
Memory grows
      ↓
OOMKill
      ↓
Queue lost
Therefore:
queue_size = 10000is not automatically better.
4. Retry Window Matters
The diagram references:
max_elapsed_time = 5mThis is critical.
Once exceeded:
Retry stopsand queued telemetry is discarded.
Example:
retry_on_failure:
  max_elapsed_time: 5m
Backend down:
6 minutesResult:
Telemetry losteven if queue space exists.
SRE Production Recommendations
For Kubernetes / OpenStack / AI observability clusters:
Small environments
queue_size: 1000
block_on_overflow: false
Simple and safe.
Large production clusters
queue_size: 5000-10000

retry_on_failure:
  enabled: true

storage: file_storage

memory_limiter:
  limit_mib: 2048
Provides:
- outage tolerance
- controlled memory use
- restart resilience
Critical telemetry
For audit/security/compliance:
block_on_overflow: trueor
Kafka
↓
OTEL Collectors
↓
Backend
so that telemetry is not silently dropped.
Final Verdict
Accuracy: 9/10
The infographic correctly explains:
- Exporter queue behaviour
- Queue sizing impact
block_on_overflow=truevsfalse- Backpressure propagation
- Data loss trade-offs
- Memory trade-offs
- Retry interactions
The only major omissions are:
memory_limiterprocessor- Persistent queues (
file_storage) - OOMKill considerations in Kubernetes
- Exact interaction with
retry_on_failure.max_elapsed_time
For an SRE interview discussing OpenTelemetry Collector resilience, the content is technically sound and reflects how the collector behaves during real backend outages.
The missing 1 point of the 9/10 for Accuracy is not because the infographic is fundamentally wrong. It’s because it simplifies several implementation details that become important in real production environments. I’d break it down like this:
| Area | Infographic | Reality |
|---|---|---|
| Queue memory usage | Assumes queue size directly maps to memory use | Batch sizes vary enormously |
| Retry behaviour | Simplified | Exporter retry policies are more complex |
| Memory limiter | Not shown | Often intervenes before queue fills |
| Persistent queues | Not shown | Can completely change failure behaviour |
| Backpressure | Simplified | Depends on receiver/exporter protocol |
| Multi-pipeline collectors | Not shown | Pipelines can fail independently |
The biggest technical issue is actually the memory calculation.
1. Queue Size ≠ Memory Usage
The infographic implies:
queue_size = 1000
≈ 4x memory of queue_size = 250
This is only approximately true.
The queue stores batches, not telemetry items.
Example:
Batch A:
10 metricsBatch B:
10000 metricsBoth count as:
1 queue entryTherefore:
queue_size = 1000could consume:
50 MBor
5 GBdepending on batching.
This is why the Collector team strongly recommends:
memory_limiter:alongside sending queues.
2. Queue Fill Time Calculation Is Illustrative Only
The infographic says:
250 queue
10 batches/sec

≈ 25 seconds
This is mathematically correct:
250÷10=25
But in production:
Retry delay
CPU pressure
Batch processor
Network latency
all affect queue growth.
A collector might fill much faster or much slower.
The infographic does mention this in small text, so I wouldn’t call it wrong.
3. block_on_overflow=true Is More Nuanced
The infographic implies:
Queue full
↓
Receiver blocks
↓
Backpressure
This is usually true.
However:
Some receivers cannot fully propagate backpressure.
Examples:
- Syslog UDP
- Fluent Forward UDP
- StatsD
- Prometheus scrape model
For those:
Collector blocksdoesn’t necessarily mean:
Application slows downbecause the sender may simply continue emitting data.
The data can still be dropped elsewhere.
4. Retry Window Simplification
The graphic assumes:
Backend down
↓
Queue fills
↓
Overflow
In reality:
Backend down
↓
Retries
↓
max_elapsed_time reached
↓
Data discarded
can occur before queue pressure becomes the dominant issue.
For example:
retry_on_failure:
  max_elapsed_time: 30s
with:
queue_size: 10000You might lose telemetry due to retry expiry long before the queue fills.
5. Missing Persistent Queue Storage
This is probably the largest omitted feature.
The diagram assumes:
Collector restart
↓
Queue lost
because it is discussing:
sending_queue:with in-memory storage.
Modern production collectors often use:
extensions:
  file_storage:
and
sending_queue:
  storage: file_storage
Then:
Collector restart
↓
Queue survives
which dramatically changes outage behaviour.
6. Missing Memory Limiter
For Kubernetes SREs this is probably the most important omission.
Most production configs contain:
processors:
  memory_limiter:
Example:
memory_limiter:
  limit_mib: 2048
When memory gets close to the limit:
Memory limiter activates
↓
Rejects telemetry
↓
Queue growth slows
So the collector may never actually reach the queue overflow state shown.
If I Were Reviewing This Diagram
I’d score the individual sections:
| Topic | Accuracy |
|---|---|
| Queue mechanics | 10/10 |
| block_on_overflow explanation | 10/10 |
| Backpressure concept | 9/10 |
| Retry behaviour | 8/10 |
| Memory modelling | 8/10 |
| Production Kubernetes considerations | 7/10 |
| Educational value | 10/10 |
Overall:
For teaching engineers how sending_queue works: 10/10.
For modelling real-world OpenTelemetry Collector behaviour in a production Kubernetes observability platform: about 9/10, because the interaction with memory_limiter, persistent queues, retry expiry, and varying batch sizes can materially change what actually happens during an outage.
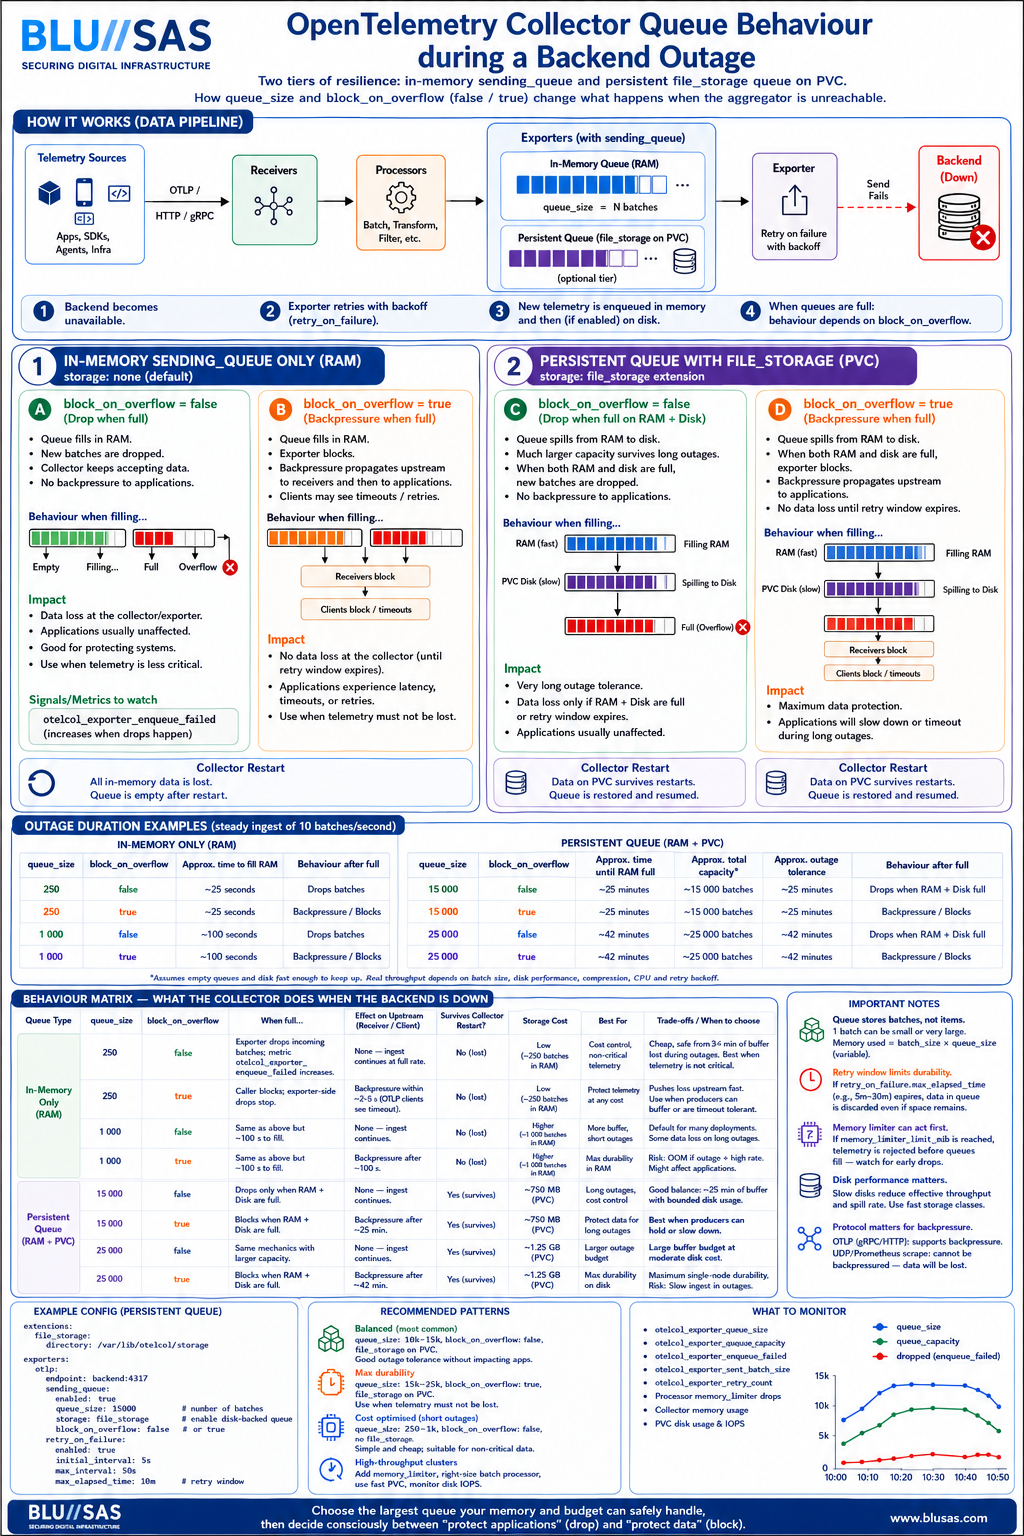
OpenTelemetry Collector resiliency during backend outages, progressing from:
Level 1
sending_queue (RAM only)to
Level 2
sending_queue (RAM)
        +
file_storage (PVC/Disk)
The second diagram is actually teaching the next level of OTEL architecture that many engineers miss.
Overall Accuracy
| Diagram | Accuracy |
|---|---|
| sending_queue only | 9/10 |
| file_storage persistent queue | 9.5/10 |
| Combined understanding | 9.5/10 |
The second diagram fixes one of the largest omissions from the first:
Collector RestartPreviously:
Queue LostNow:
Queue Surviveswhich is a huge improvement.
The Architecture
The combined architecture is:
Applications
      │
      ▼
Receivers
      │
Processors
      │
      ▼

sending_queue
(RAM)

      │
      ▼

file_storage
(PVC)

      │
      ▼

Exporter

      │
      ▼

Loki / Mimir / Tempo
This is essentially how large Grafana Cloud, Splunk, New Relic and hyperscaler OTEL deployments are built.
What The First Diagram Teaches
The first infographic teaches:
exporters:
  otlp:
    sending_queue:
      enabled: true
      queue_size: 1000
The queue exists only in memory.
During outage:
Backend Down
      │
      ▼
Retries
      │
      ▼
Queue Fills
      │
      ▼
Drop
or
Backpressure
depending on:
block_on_overflowWhat The Second Diagram Adds
The second infographic introduces:
extensions:
  file_storage:
and
exporters:
  otlp:
    sending_queue:
      storage: file_storage
Now the flow becomes:
Backend Down
      │
      ▼
Queue Fills
      │
      ▼
Queue Written To Disk
      │
      ▼
Backend Returns
      │
      ▼
Replay Queue
This is exactly correct.
Most Important Concept
Many engineers think:
file_storage
=
queue on disk
Not quite.
The diagram correctly shows:
sending_queue
       │
       ▼
file_storage
meaning:
RAM queue first
Disk queue second
The Collector still uses memory first.
Disk becomes overflow storage.
That is a very important distinction.
Queue Duration Comparison
The diagrams use:
10 batches/secfor examples.
RAM Only
queue_size = 250
250 / 10

≈ 25 sec
Correct.
queue_size = 1000
1000 / 10

≈ 100 sec
Correct.
Persistent Queue
queue_size = 15000
15000 / 10

≈ 1500 sec
≈ 25 minutes
Correct.
queue_size = 25000
25000 / 10

≈ 2500 sec
≈ 41.7 minutes
Correct.
The maths is sound.
Restart Behaviour
This is where the second infographic becomes valuable.
RAM Queue
If collector restarts:
Collector Pod
      ↓
Restart
      ↓
Memory Lost
      ↓
Queue Lost
Correct.
file_storage Queue
Collector Pod
      ↓
Restart
      ↓
PVC Survives
      ↓
Queue Recovered
Correct.
This is the biggest operational advantage.
block_on_overflow=false
Both diagrams correctly describe:
block_on_overflow: falseas:
Queue Full
      ↓
Drop Data
      ↓
Applications Unaffected
This is usually the default operational choice.
The collector sacrifices telemetry to protect workloads.
block_on_overflow=true
The diagrams correctly show:
block_on_overflow: trueas:
Queue Full
      ↓
Receiver Blocks
      ↓
Backpressure
      ↓
Applications Impacted
This is accurate for OTLP gRPC and OTLP HTTP.
One Subtle Inaccuracy
There is one place where both diagrams slightly oversimplify.
They imply:
Queue Full
      ↓
Backpressure
However:
Backpressure depends on protocol.
For example:
OTLP gRPC
Yes.
Client waitsOTLP HTTP
Usually yes.
Prometheus Scrape
Not really.
Prometheus pulls.
The application never sees backpressure.
Syslog UDP
Impossible.
UDP cannot be backpressured.
Packets simply disappear.
Therefore:
block_on_overflow=truedoes not always guarantee producer slowing.
Missing Production Component
The biggest remaining omission:
processors:
  memory_limiter:
Neither infographic shows:
memory_limiter:
  limit_mib: 2048
In production:
Memory Limiter
      ↓
Rejects Telemetry
      ↓
Queue Never Reaches Capacity
This often changes behaviour significantly.
Missing Kubernetes Reality
The diagrams assume:
Large Queue
=
Good
Not always.
Consider:
queue_size: 25000with:
Large traces
Large logs
The collector may hit:
OOMKillbefore reaching 25000 batches.
For Kubernetes SREs:
queue_size
memory_limiter
pod memory limit
PVC size
must be sized together.
Recommended Production Architecture
For your LGTM/Kubernetes/OpenStack style environments I would teach engineers the following pattern:
extensions:
  file_storage:
    directory: /var/lib/otel

processors:
  memory_limiter:
    limit_mib: 2048

exporters:
  otlp:
    sending_queue:
      enabled: true
      queue_size: 10000
      storage: file_storage
      block_on_overflow: false

    retry_on_failure:
      enabled: true
      max_elapsed_time: 10m
Architecture:
Apps
  │
  ▼
OTEL Collector
  │
  ├── Memory Limiter
  │
  ├── RAM Queue
  │
  ├── Persistent Queue (PVC)
  │
  └── Retry Engine
         │
         ▼
   Loki/Mimir/Tempo
What Engineers Should Remember
The two diagrams together teach the four most important OTEL outage concepts:
| Concept | Explanation |
|---|---|
| sending_queue | Absorbs short outages in RAM |
| block_on_overflow=false | Lose telemetry, protect applications |
| block_on_overflow=true | Protect telemetry, impact applications |
| file_storage | Survive long outages and collector restarts |
If I were turning this into a BLU//SAS training infographic for SREs, I would add a fifth pillar:
memory_limiterbecause in Kubernetes environments it is just as important as:
sending_queue
retry_on_failure
file_storage
block_on_overflow
for understanding real-world OpenTelemetry Collector resilience.
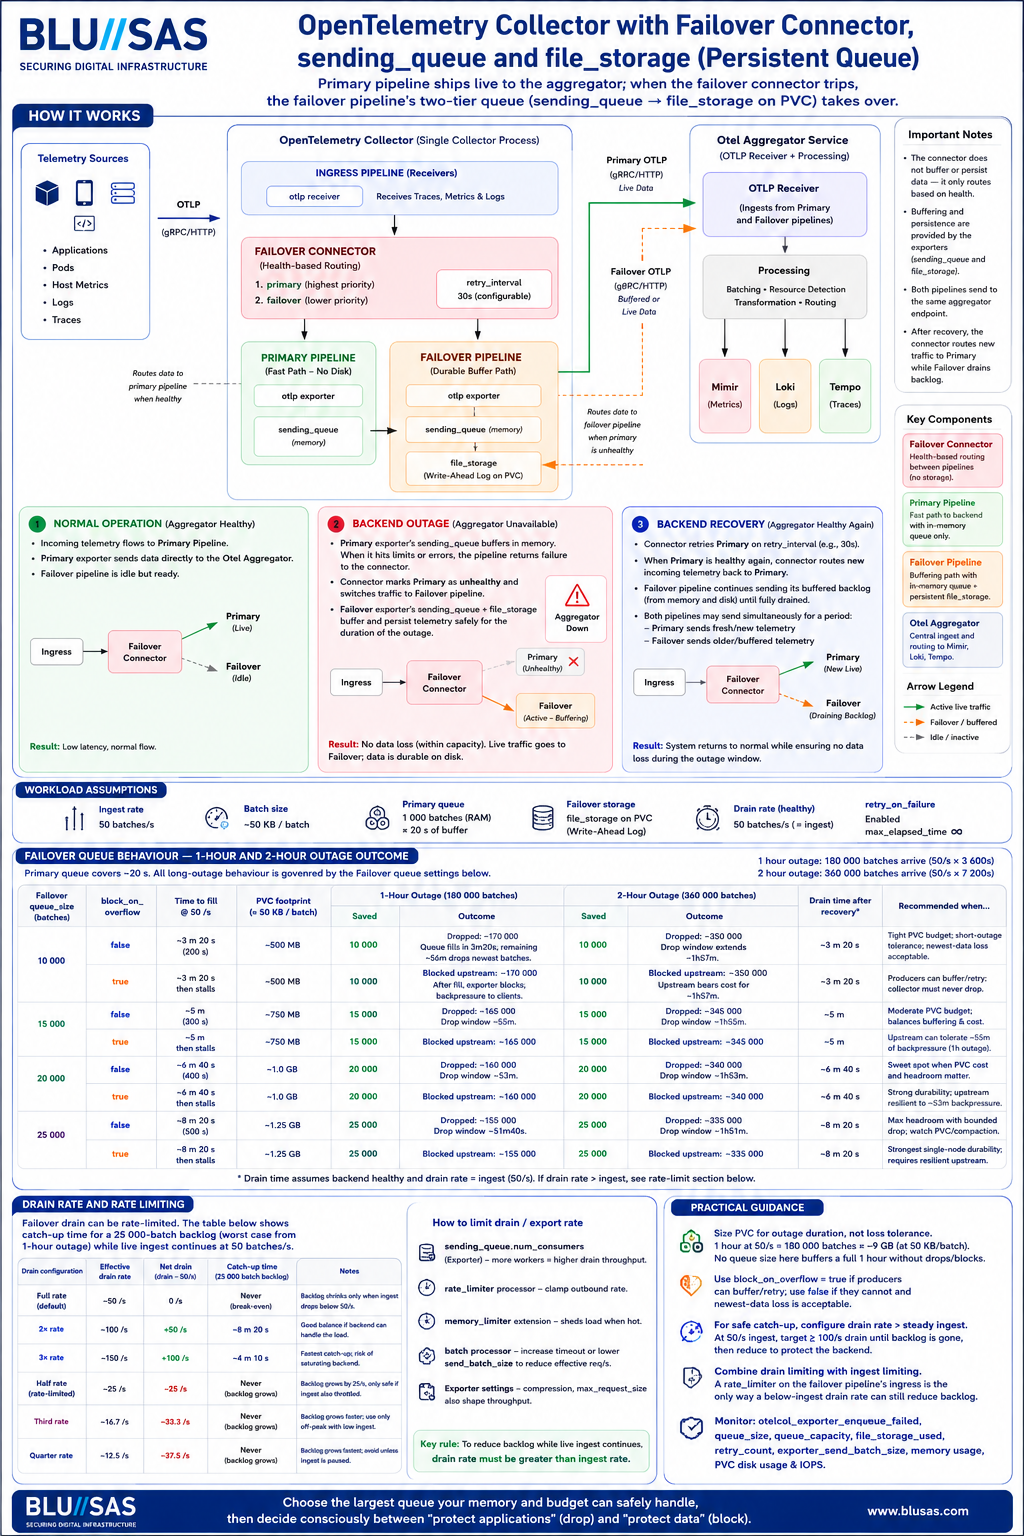
This is a sophisticated design that combines three OpenTelemetry Collector resiliency mechanisms:
- Failover Connector
- sending_queue
- file_storage persistent queue
and attempts to model outage behaviour mathematically.
Overall accuracy is approximately 8.5–9/10. The architecture is sound, but several of the numerical calculations and operational assumptions need qualification.
1. Architecture Verification
The architecture shown is:
Ingress
   │
   ▼
Failover Connector
   │
   ├─► Primary Pipeline
   │       ├─ sending_queue
   │       └─ OTLP Exporter
   │
   └─► Failover Pipeline
           ├─ sending_queue
           ├─ file_storage
           └─ OTLP Exporter

                 │
                 ▼

          OTel Aggregator
                 │
         Mimir Loki Tempo
This is valid.
The Failover Connector was designed specifically for:
Health-based routingbetween exporter pipelines.
The diagram’s routing model is accurate.
2. Primary Queue Calculations
The text states:
Primary queue
1000 batches
50 batches/sec
≈20 seconds
Verification:
1000÷50=20
Correct.
3. Persistent Queue Fill Time
The document calculates:
10,000 batches
10000 / 5010000÷50=200
200 seconds
≈3m20s
Correct.
15,000 batches
15000 / 5015000÷50=300
300 seconds
≈5 minutes
Correct.
20,000 batches
20000 / 5020000÷50=400
400 seconds
≈6m40s
Correct.
25,000 batches
25000 / 5025000÷50=500
500 seconds
≈8m20s
Correct.
4. The Biggest Numerical Problem
The infographic repeatedly says:
1 hour outage
180,000 batches arrive
and
2 hour outage
360,000 batches arrive
Let’s verify.
1 hour:
3600 × 503600×50=180000
Correct.
2 hours:
7200 × 507200×50=360000
Correct.
The arithmetic is correct.
The operational implication is where it becomes misleading.
5. Queue Size Is Far Too Small
The infographic correctly concludes:
25,000 queue
cannot absorb
1 hour outage
Let’s verify.
Required:
180,000 batchesAvailable:
25,000 batchesCoverage:
25000 / 180000≈13.9%
Only about:
8m20sof outage protection.
Therefore:
1-hour outagestill loses:
155,000 batchesCorrect.
The infographic correctly identifies this.
6. PVC Footprint Estimates
The document assumes:
50 KB / batchLet’s verify.
10k Queue
10000 × 50KB≈500 MB
Correct.
15k Queue
15000 × 50KB≈750 MB
Correct.
20k Queue
≈1 GB
Correct.
25k Queue
≈1.25 GB
Correct.
However:
This is where reality becomes dangerous.
The infographic assumes:
50 KBfixed batch size.
OTEL batches are not fixed.
Actual batch sizes may vary by:
10×
100×
1000×
depending on:
- metrics
- logs
- traces
- exemplars
- span events
Therefore:
25k queue
≈1.25 GB
should be treated as:
illustrative onlynot predictive.
7. Drain-Time Section
This is where I disagree most strongly.
The infographic states:
Drain rate 50/s
Ingest 50/s

backlog never shrinks
This is mathematically correct.
If:
Drain = 50
Ingest = 50
Net:
50 - 50 = 0Correct.
It then states:
Drain = 100/s

Net drain = 50/s
Correct.
A 25k backlog would clear in:
25000 / 5025000÷50=500
≈8m20s
Correct.
8. Hidden Assumption
The drain model assumes:
Aggregatorcan suddenly accept:
100 batches/secafter recovery.
In reality:
Most outages are caused by:
- overloaded backend
- overloaded storage
- overloaded network
Therefore:
doubling drain ratemay simply recreate the outage.
This isn’t wrong.
It is just optimistic.
9. Failover Connector Behaviour
This section is mostly correct.
Normal:
Primary healthy↓
Primary receives trafficFailover idle.
Outage:
Primary unhealthy↓
Connector routes to FailoverCorrect.
Recovery:
Primary healthy again↓
Connector returns new trafficCorrect.
However:
The actual Failover Connector is not instantaneous.
Recovery depends on:
retry_interval:and health checks.
There can be hysteresis and delays.
The diagram simplifies this.
10. Missing Production Factors
The largest omissions are:
Memory Limiter
Missing:
processors:
  memory_limiter:
This is critical.
Many queues never reach capacity because:
memory_limiterstarts rejecting telemetry first.
PVC IOPS
The infographic treats:
disk queueas infinite-speed storage.
In reality:
file_storagedepends heavily on:
- PVC latency
- IOPS
- filesystem
A slow PVC can become the bottleneck.
OOM Risk
Large queues increase:
RAMand
GC pressureinside the Collector.
Not discussed.
Retry Expiry
The text uses:
max_elapsed_time = ∞This is uncommon.
Most production systems have:
5m
10m
30m
limits.
With finite retry windows:
queued datacan still be discarded before the queue fills.
Final Verdict
Architecture
10/10
The Failover Connector + sending_queue + file_storage design is valid and follows recommended OpenTelemetry patterns.
Mathematics
9.5/10
Almost all calculations are correct.
Queue fill times, outage sizes, drain rates and PVC footprints check out.
Operational Realism
8/10
The model assumes:
- constant 50 batches/sec
- fixed 50 KB batches
- healthy backend after recovery
- unlimited disk performance
- no memory limiter
- infinite retry duration
Real clusters rarely satisfy all those assumptions.
Overall
9/10
This is a strong Staff-level explanation of OpenTelemetry failover architecture and queue mechanics. For BLU//SAS training material, I would add one final box titled:
Production Caveatscovering:
- memory_limiter
- PVC IOPS
- variable batch size
- retry expiry
- backend recovery capacity
- OOM protection
With those additions, the design would be close to a complete real-world OpenTelemetry Collector resiliency reference.