SRE observability is the engineering practice of making a system’s internal state understandable from the telemetry it produces—so an SRE can detect a problem, determine its impact, investigate its cause, and verify the recovery without needing to reproduce the failure or log directly into every machine.
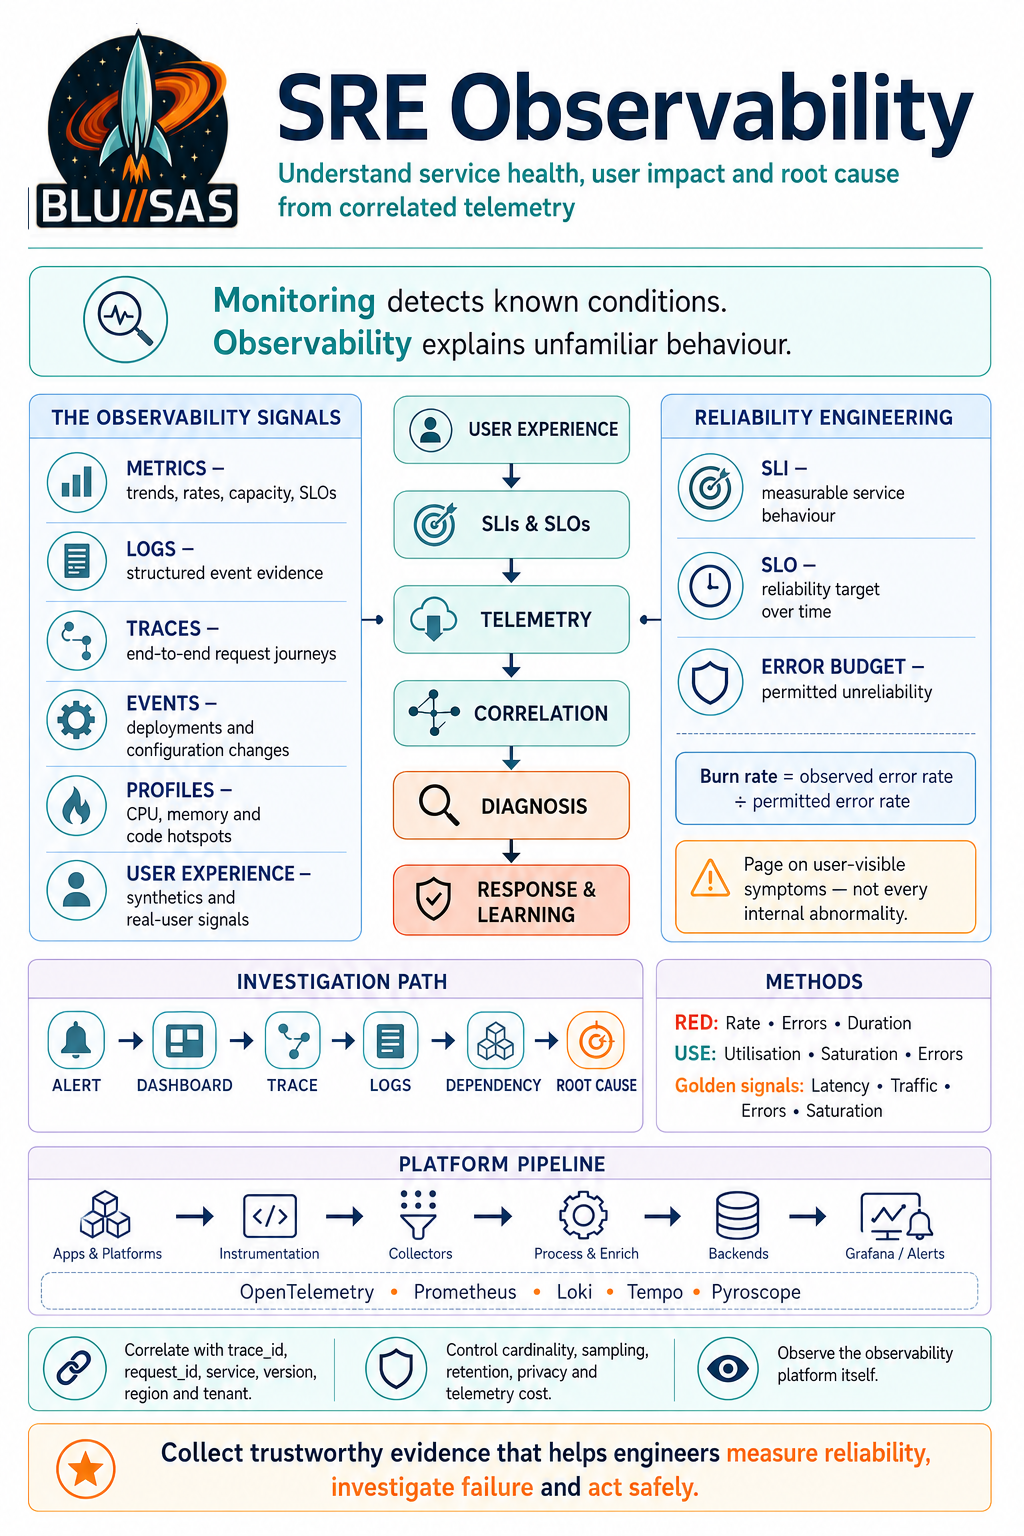
Monitoring tells you that a known condition has occurred. Observability helps you investigate conditions you did not predict.
1. The SRE purpose of observability
Observability should help answer four operational questions:
- Is the service meeting its reliability objectives?
- Which users, requests, regions or components are affected?
- Where is the failure or bottleneck occurring?
- Did the change or remediation actually fix it?
An observability platform is therefore not just Prometheus, Grafana or a collection of dashboards. It is an end-to-end capability connecting:
flowchart LR
    U["User experience"] --> S["SLIs and SLOs"]
    S --> T["Telemetry"]
    T --> C["Correlation"]
    C --> D["Diagnosis"]
    D --> R["Response and learning"]
The value comes from shortening the time between a user-visible problem and a confident explanation.
2. Monitoring versus observability
| Monitoring | Observability |
|---|---|
| Checks known failure conditions | Supports investigation of unknown conditions |
| “Is CPU above 90%?” | “Why are image uploads slow for one tenant?” |
| Often host- or component-focused | Service-, request- and user-focused |
| Built around predefined dashboards | Supports interactive querying and correlation |
| Frequently produces threshold alerts | Usually alerts from service objectives and symptoms |
| Tells you something is wrong | Helps establish what, where and why |
Monitoring remains a component of observability. The problem arises when organisations install several monitoring products and assume that the result is automatically observable.
3. The principal telemetry signals
The traditional three pillars are metrics, logs and traces. In practice, an SRE platform also needs events, profiles, topology and user-experience data.
Metrics
Metrics are numeric measurements sampled or aggregated over time.
Examples:
http_server_request_duration_seconds
http_server_requests_total
openstack_nova_running_vms
node_filesystem_avail_bytes
container_cpu_usage_seconds_total
Prometheus-style metrics usually have labels:
http_server_requests_total{
  service="image-api",
  method="POST",
  route="/v2/images",
  status_code="500",
  region="uk-1"
}
Metrics are excellent for:
- SLI and SLO calculations
- Alerting
- Capacity planning
- Trends and comparisons
- Fast aggregation across large estates
Their main limitation is that they aggregate information. A metric might show that the 99th-percentile request latency increased, but not explain which individual request was slow or why.
Counter
A counter only increases, except when the process restarts:
http_requests_total
image_upload_failures_total
Use rate() or increase() rather than graphing the raw counter:
rate(http_requests_total[5m])Gauge
A gauge can rise and fall:
queue_depth
memory_used_bytes
active_connections
Histogram
A histogram counts observations in buckets and normally exposes _bucket, _count and _sum series:
http_request_duration_seconds_bucket{le="0.1"}
http_request_duration_seconds_bucket{le="0.5"}
http_request_duration_seconds_count
http_request_duration_seconds_sum
Histograms allow server-side percentile calculation:
histogram_quantile(
  0.99,
  sum by (le) (
    rate(http_request_duration_seconds_bucket[5m])
  )
)
Histograms are normally preferred when telemetry must be aggregated across multiple service instances.
Summary
A summary calculates quantiles in the instrumented process. These quantiles cannot generally be aggregated correctly across multiple processes, making summaries less useful for distributed platform-wide analysis.
Logs
Logs are timestamped records of discrete events:
{
  "timestamp": "2026-07-16T20:14:31.482Z",
  "severity": "ERROR",
  "service.name": "glance-api",
  "trace_id": "a4d7...",
  "span_id": "91bc...",
  "request_id": "req-f134...",
  "tenant_id": "project-42",
  "image_id": "img-9831",
  "event": "object_store_write_failed",
  "error.type": "TimeoutError",
  "duration_ms": 30004
}
Structured logs are much more useful than free-form text because fields can be indexed, filtered and correlated.
Good logs explain:
- What operation was attempted
- What entity was affected
- Whether it succeeded
- Why it failed
- Which request or trace produced the event
- Which deployment version handled it
- Relevant durations and dependency details
Logs should not contain passwords, tokens, private keys or unnecessary personal data.
A useful logging model separates:
- Application logs
- Access logs
- Audit logs
- Security logs
- Infrastructure and operating-system logs
- Change and deployment events
Logs are not a substitute for metrics. Calculating every dashboard and alert by repeatedly searching massive log volumes is usually slower and more expensive than emitting appropriate metrics.
Distributed traces
A trace represents the complete journey of a request through a distributed system. Each operation is represented by a span.
flowchart TD
    A["POST image request<br/>1.8 s"] --> B["Authentication<br/>40 ms"]
    A --> C["Metadata database<br/>85 ms"]
    A --> D["Object-store upload<br/>1.6 s"]
    D --> E["Ceph RGW operation<br/>1.5 s"]
A span typically contains:
- Trace ID
- Span ID and parent span ID
- Start time and duration
- Service and operation name
- Status
- Attributes
- Events
- Links to related spans
Example attributes:
service.name = image-pipeline
http.request.method = PUT
http.route = /archive/{image_id}
http.response.status_code = 503
cloud.region = uk-1
deployment.environment = production
image.format = qcow2
storage.bucket.name = openstack-image-archive
Tracing is especially useful for:
- Microservices
- API gateways
- Asynchronous pipelines
- Message queues
- Database calls
- External API calls
- Identifying which dependency contributes latency
Tracing requires propagation of context across process boundaries, normally through HTTP headers or message metadata. If the trace context is lost at a queue, worker or legacy service, the trace becomes fragmented.
Because retaining every trace can be expensive, systems use sampling:
- Head sampling: decides when the request begins.
- Tail sampling: decides after observing the completed trace.
- Probabilistic sampling: retains a percentage.
- Policy-based sampling: retains errors, slow requests or important tenants.
- Adaptive sampling: adjusts the rate based on traffic or usefulness.
Tail sampling can preserve rare failures and slow requests that random head sampling might discard.
Events and changes
Operational events include:
- Deployments
- Configuration changes
- Feature-flag changes
- Autoscaling activity
- Node reboots
- OpenStack migrations
- Kubernetes rollouts
- Storage lifecycle transitions
- Certificate renewals
Overlaying these events on telemetry often provides the fastest explanation of a sudden change:
20:00 deployment started
20:03 error rate increased
20:05 new pods failed readiness checks
20:08 rollback started
20:11 error rate returned to normal
A mature observability platform treats change data as first-class telemetry.
Profiles
Continuous profiling identifies where applications consume CPU time, memory or other resources.
Profiles can reveal:
- Hot functions
- Lock contention
- Excessive allocations
- Memory leaks
- Garbage-collection pressure
- Inefficient code paths
Metrics might show high CPU. A trace might identify the slow endpoint. A profile can identify the precise function consuming the CPU.
User-experience signals
Infrastructure may appear healthy while users are still experiencing a broken service. Useful external signals include:
- Synthetic transactions
- Browser real-user monitoring
- Mobile application telemetry
- API availability probes
- DNS, TLS and network timings
- Business transaction completion rates
A synthetic test should exercise a meaningful transaction—for example authenticating, creating an image record, uploading a small object and retrieving its metadata—not merely check whether the front page returns HTTP 200.
4. SLI, SLO and error-budget integration
Observability becomes an SRE discipline when telemetry is connected to service objectives.
Service-Level Indicator
An SLI is a quantitative measurement of service behaviour:SLI=valid eventsgood events
For an API availability SLI:SLI=total eligible requestssuccessful requests
If 999,400 of 1,000,000 eligible requests are successful:SLI=99.94%
Service-Level Objective
An SLO is the desired target over a defined window:
99.9% of valid image-download requests will succeed over a rolling 30-day period.
A 99.9% objective permits a 0.1% error budget.
For a 30-day time-based approximation:30×24×60×0.001=43.2 minutes
Request-based SLOs are frequently more representative than time-based uptime because they weight reliability by actual user activity.
Good and bad event definitions
These definitions require care. For example:
- Should client-generated HTTP 400 responses count against the service?
- Should health checks be included?
- Are cancelled requests failures?
- Does a slow successful response count as good?
- How should planned maintenance be handled?
- Should internal administration traffic be excluded?
A latency SLI could define a good event as:
Valid request completed successfully in under 500 msThis combines correctness and responsiveness.
Error-budget burn rate
Burn rate measures how quickly the error budget is being consumed.Burn rate=permitted error rateobserved error rate
For a 99.9% SLO, the permitted error rate is 0.1%. If the observed error rate is 1%, the burn rate is:1%/0.1%=10
At that rate, the error budget is being consumed ten times faster than sustainable.
A multi-window alert might require both:
- High burn over a short window, confirming urgency
- Sustained burn over a longer window, confirming significance
This avoids paging for a tiny, momentary spike while still identifying rapidly developing incidents.
5. Symptom-based alerting
Page an SRE for user-visible symptoms, not every internal abnormality.
Good paging conditions include:
- SLO burn is high
- Requests are failing
- User latency has exceeded the objective
- A critical queue is accumulating work and breaching its processing objective
- Data correctness or durability is threatened
- Capacity will be exhausted before humans can respond during working hours
Poor page conditions include:
- CPU briefly exceeded 80%
- A single pod restarted
- A non-critical disk is 70% full
- One scrape failed
- A secondary instance became unavailable while the service remained healthy
Internal conditions can still generate tickets, warnings or diagnostic signals. They simply should not all wake someone at 03:00.
Every page should be:
- Actionable
- Owned
- Prioritised
- Linked to a runbook
- Associated with a user or service impact
- Deduplicated and routed correctly
- Tested periodically
A useful test is:
What must the on-call engineer do now that cannot safely wait until working hours?
If there is no answer, it probably should not page.
6. A modern observability architecture
A vendor-neutral architecture commonly looks like this:
flowchart TD
    A["Applications and platforms<br/>OpenStack, Kubernetes, VMs"] --> B["Instrumentation and exporters"]
    B --> C["Collectors and agents"]
    C --> D["Processing<br/>filter, enrich, sample, redact"]
    D --> E["Telemetry backends<br/>metrics, logs, traces, profiles"]
    E --> F["Grafana and query APIs"]
    F --> G["SLOs, alerting and investigation"]
Instrumentation
Telemetry originates from:
- Application libraries
- OpenTelemetry SDKs
- Prometheus client libraries
- Exporters
- Kubernetes and cloud APIs
- eBPF sensors
- System agents
- Service meshes
- Network devices
Application instrumentation is usually more semantically valuable than infrastructure-only collection because the application understands operations such as create_image, checkout or submit_job.
Collection
Collection may use:
- Prometheus scraping
- OpenTelemetry Protocol, or OTLP
- Syslog or journald
- Fluent Bit or similar log forwarders
- Cloud provider APIs
- SNMP
- Message buses
The OpenTelemetry Collector is often used as a telemetry gateway. It can receive data, batch it, enrich it, redact fields, sample traces and export to one or more backends.
A resilient design may use two tiers:
- Node-local or workload-local collectors
- Central gateway collectors
Local collectors reduce application coupling. Gateways centralise policy and backend credentials.
Processing
Typical processing includes:
- Adding environment, region and cluster metadata
- Renaming inconsistent attributes
- Removing secrets and personal data
- Filtering health-check noise
- Dropping dangerous high-cardinality attributes
- Batching and compressing data
- Tail-sampling traces
- Routing audit data to longer-retention storage
Processing rules should be version controlled and tested. An overly broad filter can silently remove the exact telemetry needed during an incident.
Storage
Different signals have different storage requirements:
| Signal | Typical storage pattern |
|---|---|
| Metrics | Time-series database |
| Logs | Indexed or object-backed log store |
| Traces | Distributed trace store |
| Profiles | Profile database or object-backed blocks |
| Events | Event index or log store |
| Long-term telemetry | Object storage and compacted blocks |
A Grafana/LGTM-style deployment might use:
- Prometheus or Mimir for metrics
- Loki for logs
- Tempo for traces
- Pyroscope for profiles
- Grafana for presentation and correlation
These are examples, not the definition of observability.
7. Cardinality: a central technical risk
Metric cardinality is the number of distinct time series generated by a metric and its label combinations.
Suppose a metric has:
- 20 services
- 10 instances per service
- 8 HTTP methods
- 50 status/route combinations
- 3 environments
Potential series:20×10×8×50×3=240,000
Adding a label such as user_id, request_id, image_id or full URL could create millions of series.
Good metric labels are bounded:
service
environment
region
http_method
normalised_route
status_code
Dangerous metric labels are effectively unbounded:
request_id
trace_id
email
user_id
object_id
raw_url
error_message
High-cardinality identifiers belong in logs and traces, where they can be queried selectively. Exemplars can connect a metric observation to a representative trace without turning the trace ID into a metric label.
8. Correlation and context
The signals must be connected. Otherwise, operators jump between tools manually and try to align timestamps.
Important correlation fields include:
service.name
service.version
deployment.environment
cloud.region
cloud.availability_zone
k8s.cluster.name
k8s.namespace.name
host.name
trace_id
span_id
request_id
tenant_id
A productive investigation path is:
- An SLO alert identifies failing requests.
- A dashboard narrows the impact to one region and endpoint.
- An exemplar opens a representative slow trace.
- The trace identifies a slow object-store operation.
- Correlated logs expose repeated RGW timeouts.
- Storage metrics show elevated latency on one Ceph pool.
- A deployment or infrastructure event reveals the preceding change.
That is observability in action: the platform supports progressive narrowing from service impact to technical cause.
9. RED, USE and golden-signal models
These models help organise instrumentation and dashboards.
RED for request-driven services
- Rate: requests or operations per second
- Errors: failed requests or operations
- Duration: latency distribution
For an image API:
Image operations per second
Failed image operations by operation and reason
p50, p95 and p99 request duration
USE for resources
- Utilisation: proportion of resource capacity in use
- Saturation: queued work or demand beyond immediate capacity
- Errors: resource-level failures
For storage:
Capacity utilisation
IOPS and throughput utilisation
I/O queue depth
Operation latency
Disk, network and checksum errors
CPU utilisation without saturation can be misleading. A CPU at 100% may be efficiently doing useful work; queued runnable processes and service latency show whether users are suffering.
Four golden signals
Google’s widely used model comprises:
- Latency
- Traffic
- Errors
- Saturation
It is a useful service-level starting point, though not a complete observability strategy.
10. Observing Kubernetes, OpenStack and infrastructure
Kubernetes
A layered Kubernetes model includes:
- Control-plane health
- Node and container resource telemetry
- Workload availability
- Deployment and scheduling events
- Application RED metrics
- Network and ingress behaviour
- Persistent-volume performance
- SLOs based on application transactions
Common sources include kube-state-metrics, node exporters, cAdvisor, control-plane metrics, container logs and application traces.
A pod restart is not automatically a service incident. The important question is whether it affected availability, latency, capacity or correctness.
OpenStack
For OpenStack, useful telemetry includes:
- Keystone authentication success and latency
- Nova API operations and build outcomes
- Scheduler decisions and placement failures
- Neutron port, DHCP, agent and network status
- Glance image upload/download performance
- Cinder volume-operation performance
- RabbitMQ queue depth, consumer state and publish rates
- Database latency, locks and connection saturation
- HAProxy request metrics
- Libvirt and compute-node capacity
- Ceph health, latency, recovery and capacity
A VM build is a distributed transaction crossing API services, schedulers, message queues, databases, networking, image storage, compute and possibly block storage. A single request_id or trace should ideally follow that transaction.
For your Kolla-Ansible environment, an effective path would correlate:
HAProxy → Nova/Glance/Neutron API → RabbitMQ → workers
→ MariaDB → libvirt/OVS → Ceph or image storage
The existing OpenStack exporter gives valuable state and capacity metrics, but it will not by itself provide complete request-level diagnosis. Service logs, request-ID correlation, RabbitMQ/database telemetry and selective tracing are also needed.
11. Observability for asynchronous pipelines
A build or image-archive pipeline is not adequately observed using HTTP metrics alone.
You need telemetry for:
- Items entering the pipeline
- Current stage
- Queue wait time
- Stage processing time
- End-to-end completion time
- Retry count
- Failure classification
- Dead-letter queue depth
- Stalled items
- Produced artefact size and checksum
- Archive-write and verification outcome
- Cleanup and lifecycle operations
Example pipeline SLIs:Completion SLI=valid production images submittedimages successfully archived within 15 minutes Integrity SLI=archived objects verifiedarchived objects passing checksum verification
The most important identifier is normally a correlation ID carried through every stage. For an image archive, this might coexist with the image UUID, build ID, pipeline-run ID and object version ID.
12. Dashboard design
Dashboards should be arranged by operational question, not by whichever metrics were easiest to collect.
A useful hierarchy is:
Service overview
- Current SLO compliance
- Error-budget remaining
- Request rate
- Error rate
- Latency
- Major dependencies
- Active deployments and incidents
Diagnostic drill-down
- Endpoint or operation
- Region or availability zone
- Deployment version
- Tenant class
- Dependency
- Failure reason
- Instance or host
Component detail
- Runtime and garbage collection
- Queues and worker pools
- Database queries and connections
- Cache hit ratios
- Network and storage
- Container and host resources
Avoid putting every metric on one enormous “single pane of glass”. A useful dashboard guides an investigation; it does not merely display a wall of graphs.
13. Telemetry reliability
The observability system is itself a production system and must be observable.
Measure:
- Scrape and export failures
- Dropped spans and logs
- Collector queue length
- Collector memory-limiter activations
- Ingestion delay
- Query latency
- Storage capacity
- Rule-evaluation failures
- Alert delivery failures
- Sampling rates
- Telemetry cost by team or service
Important telemetry may need:
- Local buffering
- Backpressure handling
- Redundant collectors
- Multiple availability zones
- Durable queues
- Independent external probes
A failure in the main platform must not make every diagnostic signal disappear at exactly the moment it is needed.
14. Governance, security and cost
Observability data is operationally valuable but may also be sensitive.
Controls should cover:
- Role-based access
- Tenant isolation
- Encryption in transit and at rest
- Retention policies
- Audit access
- Data residency
- Secret and PII redaction
- Deletion requirements
- Controlled dashboard and alert changes
Cost is driven by:
- Metric cardinality
- Log volume and indexing
- Trace sampling
- Retention period
- Replication
- Query patterns
- Duplicate telemetry
- Uncontrolled debug logging
A practical retention model may keep:
- High-resolution metrics for weeks
- Downsampled metrics for months or years
- Routine logs for a shorter period
- Audit/security logs according to policy
- Sampled traces for days or weeks
- Incident traces or profiles for longer analysis
Retention should follow operational and regulatory value, not a single setting applied to every signal.
15. Observability maturity
A typical progression is:
- Component monitoring
Host checks, basic dashboards and threshold alerts. - Centralised telemetry
Metrics and logs collected consistently. - Service orientation
RED metrics, ownership, standard metadata and runbooks. - SLO-based operations
User-centred SLIs, error budgets and burn-rate alerting. - Cross-signal correlation
Metrics, logs, traces, profiles and changes connected. - Automated diagnosis and remediation
Telemetry drives enrichment, safe automation and conversational investigation.
The final stage is where AIOps and MCP-integrated operational assistants become useful. An AI system can query Prometheus, Loki, Tempo, Kubernetes and OpenStack APIs, correlate the evidence and propose a diagnosis. But it needs well-structured telemetry, reliable service ownership and controlled permissions. AI cannot compensate for missing identifiers, inconsistent labels or uninstrumented service boundaries.
In short, strong SRE observability is not “collect everything.” It is the deliberate production of enough trustworthy, correlated evidence to measure user reliability, investigate unfamiliar failures and make safe operational decisions quickly.
MELT and the Pillars of Observability
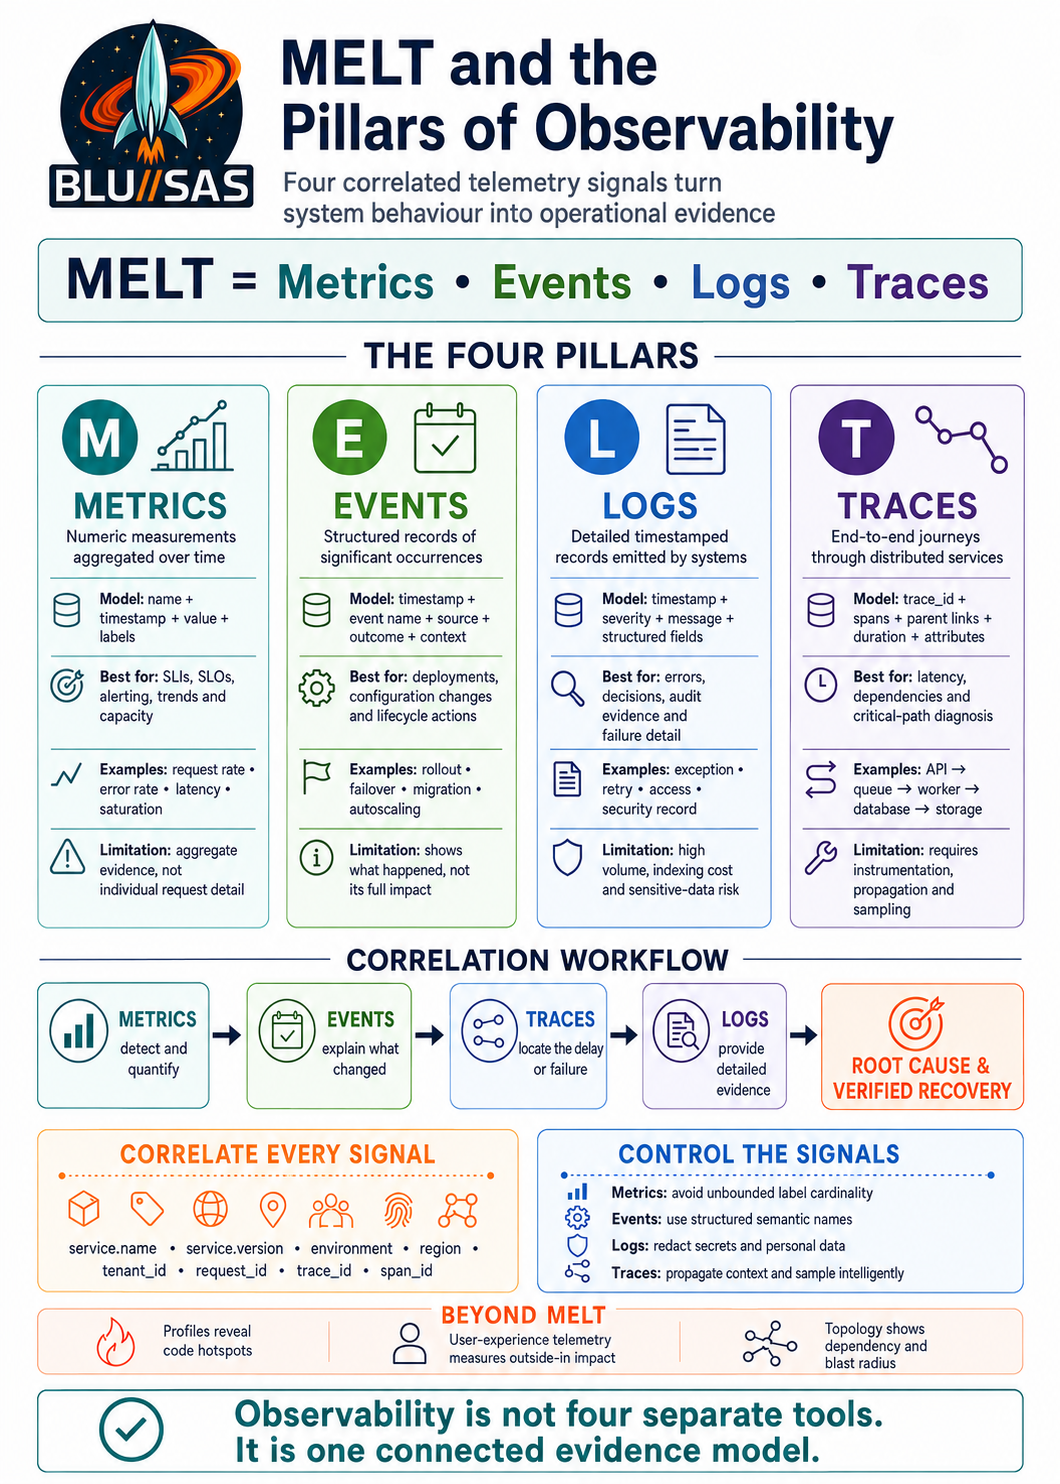
What MELT stands for
MELT is a practical model for the four principal telemetry signals used in observability:
| Letter | Signal | Core question |
|---|---|---|
| M | Metrics | What is changing, and how much? |
| E | Events | What happened at a specific moment? |
| L | Logs | What evidence did the system record? |
| T | Traces | Where did a request spend its time? |
These signals are often called the “pillars of observability”. They are most powerful when they are correlated using shared fields such as:
service.name
service.version
deployment.environment
cloud.region
host.name
tenant_id
request_id
trace_id
span_id
MELT is not four independent monitoring systems. It should behave as one connected evidence model.
1. Metrics
Metrics are numeric measurements collected or calculated over time. They provide a compressed, aggregate view of system behaviour.
Examples include:
Requests per second
Error rate
Response latency
Queue depth
CPU utilisation
Available storage
Number of active instances
A Prometheus metric might look like:
http_server_requests_total{
  service="glance-api",
  operation="image_download",
  status_code="200",
  region="uk-1"
} 1893402
Metric data model
A metric time series consists of:
- Metric name
- Timestamp
- Numeric value
- Labels or attributes
The complete set of labels identifies a unique time series:
metric_name + label combination = time seriesFor example:
http_requests_total{
  service="nova-api",
  method="POST",
  route="/servers",
  status_code="202"
}
Changing any label value produces a different series.
Metric types
Counter
A counter is cumulative and normally only increases:
http_requests_total
image_archive_failures_total
network_packets_dropped_total
A process restart may reset it to zero. The useful calculation is usually its rate:
rate(http_requests_total[5m])A failure ratio can be calculated as:
sum(rate(http_requests_total{status_code=~"5.."}[5m]))
/
sum(rate(http_requests_total[5m]))
Gauge
A gauge represents a value that can increase or decrease:
active_connections
queue_depth
filesystem_available_bytes
running_instances
Gauges describe current state, but care is needed when aggregating them. Summing available capacity across nodes may be meaningful; summing percentages often is not.
Histogram
A histogram records observations in configurable buckets:
http_request_duration_seconds_bucket{le="0.1"}
http_request_duration_seconds_bucket{le="0.5"}
http_request_duration_seconds_bucket{le="1.0"}
It also normally exposes:
http_request_duration_seconds_count
http_request_duration_seconds_sum
Histograms support aggregated percentile estimation:
histogram_quantile(
  0.99,
  sum by (le) (
    rate(http_request_duration_seconds_bucket[5m])
  )
)
This calculates an estimated p99 request duration.
Histograms are particularly valuable for latency because averages conceal the slowest requests. A service with a 100 ms average can still have a damaging five-second p99.
Summary
A summary calculates quantiles inside the instrumented process. Unlike histogram buckets, precomputed summary quantiles generally cannot be aggregated correctly across multiple instances.
For distributed services, histograms are therefore usually more flexible.
What metrics are best for
Metrics are well suited to:
- SLI and SLO calculation
- Alerting
- Error-budget burn rates
- Capacity planning
- Performance baselines
- Trend analysis
- Fleet-wide aggregation
- Service and infrastructure dashboards
Metric limitations
Metrics deliberately discard individual-event detail. A metric can show that 2% of image uploads failed, but it may not show:
- Which image uploads failed
- Which request handled them
- What exception occurred
- Which dependency timed out
- Whether all failures affected one tenant
Metrics also create a cardinality risk. Never use unbounded values as ordinary metric labels:
request_id
trace_id
user_id
image_id
email_address
raw URL
error message
These can produce millions of unique time series, increasing memory, storage and query costs.
Use metrics to detect and quantify a condition; use logs and traces to investigate individual examples.
2. Events
An event is a structured record indicating that something significant happened at a particular moment.
Examples include:
- Deployment completed
- Configuration changed
- Virtual machine migrated
- Kubernetes pod evicted
- Certificate renewed
- Feature flag enabled
- Object moved to an archive tier
- Autoscaler added three workers
- Storage node entered recovery
- Pipeline stage failed
An event might be represented as:
{
  "timestamp": "2026-07-16T14:05:31Z",
  "event.name": "deployment.completed",
  "service.name": "image-api",
  "service.version": "3.8.2",
  "deployment.environment": "production",
  "cloud.region": "uk-1",
  "deployment.id": "deploy-7392",
  "initiator.type": "pipeline",
  "result": "success"
}
Events versus logs
The boundary is not absolute:
- A log is a record emitted by a system or application.
- An event represents an occurrence with operational significance.
Events may be stored in a log backend, but conceptually they deserve separate treatment because they explain changes in system state.
A deployment event is much more valuable when it appears directly on a latency graph:
14:05 deployment completed
14:07 p99 latency increased
14:08 error-budget burn alert fired
14:11 rollback started
14:14 latency recovered
Event characteristics
Good events are:
- Timestamped accurately
- Structured
- Semantically named
- Associated with a source
- Enriched with affected services and resources
- Connected to a change, deployment or actor
- Classified by result and severity
Useful fields include:
event.name
event.category
event.action
event.outcome
event.reason
change.id
deployment.id
service.name
service.version
resource.id
initiator.type
What events are best for
Events help explain:
- Why behaviour changed
- Whether a deployment caused a regression
- When capacity was added or removed
- Whether a failover occurred
- Which configuration version was active
- What lifecycle action affected an object
- When an incident or remediation started
Event limitations
An event normally tells you that something happened, but not necessarily:
- Its aggregate effect over time
- Every technical detail surrounding it
- The full path of an affected request
- The resulting user impact
Events should therefore be overlaid on metrics and linked to relevant logs and traces.
3. Logs
Logs are timestamped records generated by applications, platforms, operating systems and infrastructure components.
They contain detailed evidence about discrete operations and failures.
Unstructured logs
Traditional text logs may look like:
2026-07-16 14:10:08 ERROR Failed to upload image: RGW timeoutThese are readable but difficult to query consistently. Parsing may depend on fragile regular expressions.
Structured logs
Structured logs represent information as named fields:
{
  "timestamp": "2026-07-16T14:10:08.481Z",
  "severity": "ERROR",
  "service.name": "glance-api",
  "service.version": "3.8.2",
  "event.name": "image.upload.failed",
  "image.id": "79cfa829",
  "tenant.id": "project-42",
  "request_id": "req-5d61",
  "trace_id": "e8a97f42",
  "span_id": "6b2d18c0",
  "dependency": "ceph-rgw",
  "error.type": "TimeoutError",
  "error.message": "Object write exceeded deadline",
  "duration_ms": 30004
}
This allows queries such as:
service.name = "glance-api"
AND event.name = "image.upload.failed"
AND dependency = "ceph-rgw"
AND cloud.region = "uk-1"
Categories of logs
Application logs
Describe application operations, decisions and failures:
Authentication rejected
Image validation failed
Database transaction retried
Archive object created
Access logs
Record incoming requests:
HTTP method
Route
Status code
Response size
Duration
Client classification
Trace ID
Audit logs
Record security- or governance-relevant activity:
Who performed the operation
What resource was affected
When it happened
What action was requested
Whether it succeeded
Audit logs require stricter integrity, access and retention controls than normal diagnostic logs.
Infrastructure logs
Include:
Kernel messages
Systemd journal
Hypervisor logs
Storage daemon logs
Network service logs
Container runtime logs
Security logs
Include authentication, authorisation, policy, threat and anomalous-access records.
Log levels
Typical severity levels are:
TRACE: extremely detailed execution informationDEBUG: diagnostic development informationINFO: expected operational activityWARN: abnormal but currently recoverable behaviourERROR: operation failedFATAL: process or critical component cannot continue
An ERROR should not automatically create a page. One failed operation may be expected, retried or caused by invalid client input. Paging should be based on user impact and SLO consumption.
What good application logs contain
A useful log record should identify:
- What operation occurred
- Which service produced it
- Which resource was involved
- Whether it succeeded
- How long it took
- Why it failed
- Whether it will be retried
- Which request or trace produced it
- Which software version handled it
Log limitations
Logs can be expensive because of:
- High ingestion volume
- Indexing
- Long retention
- Repeated stack traces
- Debug logging
- Large embedded payloads
Logs can also expose sensitive information. They should not contain:
Passwords
API tokens
Session cookies
Private keys
Full authentication headers
Unnecessary personal data
Raw confidential payloads
Redaction should happen as close as possible to the source or at the telemetry collector.
Logs provide depth, but searching billions of log records is generally not the best way to calculate every alert and dashboard. Metrics provide the aggregate view more efficiently.
4. Traces
A distributed trace represents the end-to-end journey of a request or transaction through multiple components.
For example, an OpenStack image upload might cross:
flowchart LR
    A["HAProxy"] --> B["Glance API"]
    B --> C["Keystone"]
    B --> D["Database"]
    B --> E["Ceph RGW"]
The complete operation is the trace. Each individual operation is a span.
Trace and span structure
A span normally contains:
trace_id
span_id
parent_span_id
service.name
operation name
start timestamp
duration
status
attributes
events
links
Example:
{
  "trace_id": "e8a97f42",
  "span_id": "6b2d18c0",
  "parent_span_id": "93f44a01",
  "service.name": "glance-api",
  "span.name": "PUT archive object",
  "span.kind": "CLIENT",
  "duration_ms": 1843,
  "status": "ERROR",
  "storage.system": "s3",
  "server.address": "rgw.internal",
  "error.type": "TimeoutError"
}
Span hierarchy
A trace might show:
POST /v2/images                         2,180 ms
├── Validate image metadata               32 ms
├── Authenticate with Keystone            48 ms
├── Write database record                 71 ms
└── Upload object to Ceph RGW          2,011 ms
    ├── Resolve RGW endpoint                4 ms
    ├── Establish connection               26 ms
    └── Write object                    1,970 ms
The critical path immediately indicates that object storage dominated the total duration.
Context propagation
Trace context must cross every service boundary.
For HTTP, trace identifiers are normally propagated in headers such as the W3C Trace Context format:
traceparent: 00-<trace-id>-<span-id>-<flags>For asynchronous messaging, the context must be inserted into message metadata and extracted by the consumer.
Without propagation:
API trace → ends
Worker trace → starts independently
With propagation:
API span → queue publish span → queue consume span → worker spanThis is particularly important for:
- RabbitMQ
- Kafka
- Background workers
- CI/CD pipelines
- Image-building pipelines
- Slurm job submission
- Object lifecycle processing
Span types
Common span kinds include:
SERVER: handling an incoming requestCLIENT: calling another servicePRODUCER: sending a message or work itemCONSUMER: receiving a message or work itemINTERNAL: work within the process
Span attributes and events
Attributes describe the operation:
http.request.method
http.route
http.response.status_code
db.system
db.operation.name
messaging.system
server.address
service.name
cloud.region
Span events record something that occurred during the operation:
Retry attempted
Exception raised
Cache miss
Connection re-established
A span event is not the same as a top-level operational event, although both represent occurrences.
Sampling
Tracing every request can generate substantial volume. Sampling controls what is retained.
Head sampling
The decision is made when the trace begins.
Advantages:
- Simple
- Low overhead
- Predictable volume
Disadvantage:
- The system does not yet know whether the request will be slow or fail.
Tail sampling
The decision is made after most or all of the trace has been observed.
It can retain traces that:
- Contain errors
- Exceed a latency threshold
- Involve a critical tenant
- Pass through a particular component
- Exhibit an unusual attribute
Tail sampling is more operationally useful but requires collectors to buffer trace data while awaiting completion.
Adaptive sampling
Sampling rates change in response to traffic, service importance or error patterns.
What traces are best for
Traces help with:
- Locating distributed latency
- Identifying failing dependencies
- Understanding request fan-out
- Diagnosing service-to-service failures
- Following asynchronous transactions
- Comparing application versions
- Finding retry amplification
- Examining database and storage calls
Trace limitations
Tracing depends on instrumentation and context propagation. A trace may be incomplete when:
- A service is not instrumented
- Headers are removed
- Message context is not preserved
- Sampling decisions conflict
- Legacy components cannot propagate context
- Clocks are badly synchronised
A trace also represents one transaction. It does not on its own show whether the behaviour affects one request or 30% of the service. Metrics provide that population-level context.
How the MELT pillars work together
Consider an OpenStack image upload problem.
1. Metrics detect and quantify it
Image-upload success rate falls from 99.98% to 96%
p99 upload duration rises from 8 seconds to 31 seconds
RGW request latency increases
The SLO burn-rate alert fires.
2. Events provide change context
A new Glance version was deployed six minutes earlier
A Ceph rebalance started in the affected availability zone
3. Traces locate the delay
A slow trace shows that 27 seconds of a 30-second request were spent waiting for an object-storage write.
4. Logs provide failure evidence
Correlated RGW and Glance logs show:
Timeout during multipart object upload
Retry 1 of 3
Affected pool: images-archive
Request ID and trace ID
Together, the signals answer different parts of the investigation:
| Signal | Answer |
|---|---|
| Metrics | How widespread and severe is it? |
| Events | What changed around the same time? |
| Logs | What exactly did the components record? |
| Traces | Where did the transaction fail or slow down? |
Correlation is more important than collection
Simply installing four telemetry products does not make a system observable. The signals must share consistent resource and request context.
A strong correlation model includes:
service.name
service.namespace
service.version
deployment.environment
cloud.provider
cloud.region
cloud.availability_zone
host.name
k8s.cluster.name
k8s.namespace.name
tenant.id
request_id
trace_id
span_id
This supports an investigation path such as:
SLO alert
  → affected service dashboard
  → metric exemplar
  → representative trace
  → failing span
  → logs with the same trace_id
  → deployment event
  → root cause
An exemplar connects an aggregated metric observation—such as a slow latency histogram bucket—to a representative trace ID.
Beyond MELT
Modern observability often includes signals beyond the four MELT pillars.
Profiles
Continuous profiles identify which functions consume:
- CPU time
- Memory
- Allocations
- Lock time
- I/O time
Metrics show that CPU has increased. Traces show which endpoint is slow. Profiles show which function consumes the CPU.
User-experience telemetry
This includes:
- Synthetic transactions
- Real-user monitoring
- Browser timing
- Mobile application telemetry
- DNS and TLS timings
- Business transaction success
It provides the outside-in view that infrastructure telemetry can miss.
Topology
Topology records relationships between:
- Services
- Hosts
- clusters
- Networks
- Databases
- Queues
- Storage systems
Dynamic topology helps determine the possible blast radius of a failing dependency.
SLO and error-budget data
SLOs are derived from telemetry but act as a distinct operational layer. They translate technical measurements into reliability and user-impact decisions.
Practical summary
MELT should be understood as a set of complementary data types:
- Metrics provide breadth: efficient numerical summaries across the entire service.
- Events provide change context: significant occurrences that may explain a change in behaviour.
- Logs provide depth: detailed evidence about individual operations and failures.
- Traces provide causality and flow: the path and timing of a transaction through distributed components.
The real foundation of observability is not the number of signals collected. It is the ability to move quickly from:
User impact → affected population → representative transaction
→ failing component → technical evidence → verified recovery
That requires consistent instrumentation, shared identifiers, controlled cardinality, sensible retention, secure collection and service-level objectives—not merely four separate telemetry backends.
Observability Platform Engineering
Observability Platform Engineering is the discipline of designing, operating and evolving the shared systems that collect, process, store and expose operational telemetry across an organisation.
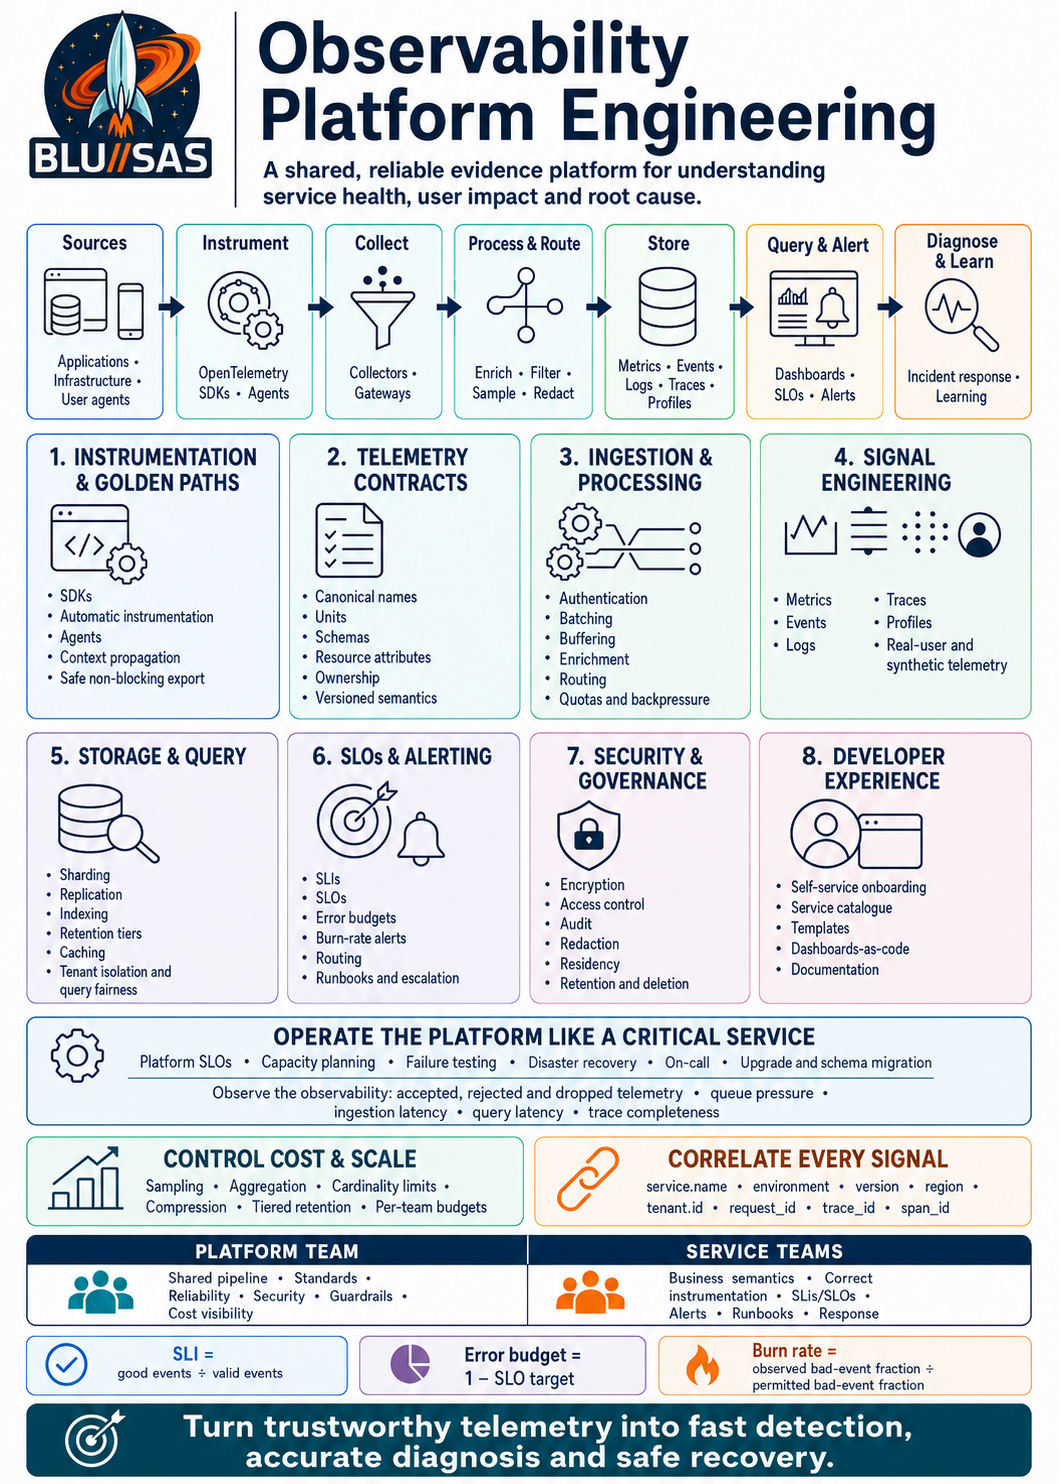
The objective is to give engineers trustworthy evidence about service behaviour, user impact and system dependencies—without requiring every application team to build and operate its own monitoring stack.
It combines platform engineering, distributed systems, SRE, data engineering, security and developer experience.
Core platform architecture
A typical observability platform implements this telemetry path:
flowchart TD
    A["Applications, infrastructure and user agents"] --> B["SDKs, agents and automatic instrumentation"]
    B --> C["Local or edge collectors"]
    C --> D["Ingestion gateway"]
    D --> E["Process, enrich, filter and route"]
    E --> F["Metrics backend"]
    E --> G["Log backend"]
    E --> H["Trace backend"]
    E --> I["Profile and event backends"]
    F --> J["Query, dashboards and alerting"]
    G --> J
    H --> J
    I --> J
    J --> K["Diagnosis, response and learning"]
The platform team owns this path as a production service, including its availability, capacity, latency, security, cost and usability.
1. Telemetry instrumentation
Platform engineers define how applications produce telemetry. This usually includes:
- OpenTelemetry SDKs and automatic instrumentation.
- Host, container, Kubernetes, database and network agents.
- Browser and mobile real-user monitoring.
- Language-specific libraries and framework integrations.
- Standard APIs for custom metrics, structured events, logs and spans.
- Instrumentation for asynchronous messaging, batch processing and serverless workloads.
They publish approved instrumentation packages—often called a “golden path”—with sensible defaults for context propagation, sampling, resource detection and export.
A good implementation automatically attaches common resource attributes such as:
service.name
service.namespace
service.version
deployment.environment.name
cloud.region
k8s.cluster.name
k8s.namespace.name
team.owner
tenant.id
The platform team must prevent instrumentation from entering request-critical failure paths. Telemetry libraries should use bounded queues, timeouts, batching and non-blocking export. An unavailable collector must not normally make the observed application unavailable.
2. Semantic standards and telemetry contracts
Raw data is not useful unless services describe the same concepts consistently. Platform engineers therefore establish telemetry contracts covering:
- Metric names, units, types and aggregation temporality.
- Required resource and event attributes.
- Log schemas and severity conventions.
- Span names, kinds, status and error representation.
- Service and deployment identity.
- Correlation identifiers.
- Data ownership and retention classes.
- Rules for secrets and personal information.
For example, request duration should be represented consistently rather than appearing as unrelated fields such as response_ms, latency, elapsed and duration_seconds.
Contracts are enforced through schema validation, CI checks, collector processors and catalogue governance. Breaking schema changes should be versioned because dashboards, alerts and automation depend on them like consumers depend on an API.
3. Context propagation and correlation
Correlation turns separate telemetry streams into one evidence model.
Platform engineers implement propagation of trace context and business context across:
- HTTP and RPC calls.
- Message queues and event streams.
- Background jobs.
- Serverless invocations.
- Database operations.
- Browser-to-backend requests.
- Cross-region and cross-cloud boundaries.
Logs can include trace_id and span_id; exemplars can connect metric points to representative traces; deployment events can be overlaid on performance graphs; and traces can link to profiles recorded during a slow span.
The platform must also control context size and trust boundaries. Arbitrary baggage propagation can expose sensitive data, increase network overhead and create unbounded cardinality.
4. Collection and ingestion
Collectors and ingestion gateways decouple applications from storage vendors and backends. Their responsibilities commonly include:
- Receiving OTLP and other supported protocols.
- Authenticating producers.
- Batching and compressing telemetry.
- Buffering transient failures.
- Applying memory and concurrency limits.
- Enriching records with infrastructure metadata.
- Redacting or hashing sensitive fields.
- Filtering unwanted data.
- Normalising schemas.
- Routing data by signal, region, tenant or retention class.
- Applying rate limits and quotas.
- Exporting to one or more backends.
Large deployments use multi-tier collection: node-local agents forward to regional gateways, which process and route telemetry to storage. Engineers model queue sizes, retry behaviour and backpressure carefully. Unlimited retries merely move an outage into memory, disk or network exhaustion.
For each stage they track:Accepted=Received−Rejected−Dropped
Loss must be classified by cause—for example rate limiting, queue overflow, malformed data, sampling or exporter failure—rather than hidden inside a single drop counter.
5. Signal-specific engineering
Metrics
Metrics provide compact, aggregated measurements over time. Platform work includes:
- Counter, gauge and histogram conventions.
- Prometheus scraping or OTLP metric ingestion.
- Recording rules and pre-aggregation.
- Histogram bucket or exponential-histogram policy.
- High-availability deduplication.
- Remote write and long-term storage.
- Exemplars linking metrics to traces.
- Cardinality analysis and limits.
Cardinality is a central engineering constraint. A metric with label dimensions L1…Ln can approach:series count≈i=1∏n∣Li∣
User IDs, request IDs, raw URLs and unbounded error messages therefore do not belong in metric labels.
Events
Events represent significant state changes such as deployments, failovers, configuration updates and feature-flag changes.
The platform provides structured event schemas containing time, source, actor, affected resource, action, outcome and correlation fields. Events are valuable for explaining why behaviour changed and should be integrated into dashboards and incident timelines.
Logs
Log engineering covers:
- Structured encoding, normally JSON or another typed format.
- Timestamp and severity normalisation.
- Multiline and exception parsing.
- Kubernetes and host log collection.
- Indexing and retention policy.
- Field extraction.
- Secret and personal-data controls.
- Archive and rehydration workflows.
Platform teams discourage treating every log field as an indexed field. Selective indexing, tiered storage and query-time parsing control cost without discarding necessary evidence.
Traces
Distributed tracing work includes:
- W3C trace-context propagation.
- Span naming and attribute conventions.
- Parent-child and span-link semantics.
- Trace completeness monitoring.
- Head, tail and adaptive sampling.
- Service graph generation.
- Trace-derived metrics.
- Critical-path and dependency analysis.
Head sampling decides before the trace outcome is known and is inexpensive. Tail sampling can retain errors and anomalously slow traces but requires collectors to buffer and assemble traces. Adaptive strategies combine baseline probabilistic sampling with policies for errors, latency, rare endpoints and high-value tenants.
Additional signals
Mature platforms often support:
- Continuous profiles for CPU, memory and lock contention.
- Real-user monitoring for actual client-side experience.
- Synthetic tests for controlled availability and journey validation.
- Network telemetry such as flows, DNS and eBPF-derived signals.
- Topology and inventory data describing runtime dependencies.
These signals extend MELT; they do not replace the need to correlate it.
6. Storage and query architecture
Platform engineers choose and operate specialised backends for time series, indexed or object-backed logs, traces and profiles.
Their work includes:
- Sharding and partitioning strategies.
- Replication and failure-domain placement.
- Tenant isolation.
- Index design.
- Compression and compaction.
- Retention and deletion.
- Hot, warm and archive tiers.
- Cache design.
- Query scheduling and fairness.
- Disaster recovery.
- Capacity forecasting.
They protect shared infrastructure from “noisy neighbour” behaviour with per-tenant ingestion quotas, query limits, concurrency controls and workload prioritisation.
Because observability systems are used during incidents, query availability matters most when production is already unhealthy. The platform must avoid sharing every failure mode with the services it observes. Regional collection, independent credentials, separate capacity and resilient control planes reduce correlated failure.
7. SLI, SLO and alerting enablement
The platform provides reusable methods for defining service reliability:
- Service-level indicators describing measured behaviour.
- Service-level objectives setting reliability targets.
- Error budgets quantifying permitted unreliability.
- Multi-window, multi-burn-rate alerts.
- Dashboard templates and service scorecards.
- Ownership and escalation metadata.
For a success-based SLI:SLI=valid eventsgood events
For an SLO target T, the error-budget fraction is:1−T
The burn rate is:Burn rate=permitted bad-event fractionobserved bad-event fraction
Platform engineers build the machinery to calculate these values consistently, but service owners remain responsible for defining what “good” means for their users.
Alerting is treated as a lifecycle rather than a rule file. The platform supports routing, deduplication, inhibition, maintenance windows, escalation, runbook links and alert-quality measurement. Alerts should identify actionable user-impact risk, not page on every internal anomaly.
8. Developer experience and self-service
An observability platform is an internal product. Its interfaces commonly include:
- A service catalogue.
- Instrumentation libraries and templates.
- Infrastructure-as-code modules.
- Dashboard and alert definitions stored in version control.
- Self-service onboarding.
- Query and dashboard portals.
- SLO configuration APIs.
- Ownership and escalation management.
- Usage and cost reports.
- Documentation, examples and troubleshooting tools.
A strong onboarding flow can register a service, install standard instrumentation, create baseline dashboards, define initial alerts and validate telemetry automatically.
Platform engineers gather feedback, measure adoption and treat poor usability as a platform defect. If teams routinely bypass the golden path, the underlying cause may be missing functionality, excessive friction or unsuitable defaults.
9. Data quality and observability of observability
The platform must observe itself. Important indicators include:
- Telemetry accepted, rejected and dropped.
- Export latency and queue utilisation.
- Scrape and export failures.
- Trace completeness.
- Missing required attributes.
- Invalid schemas.
- Out-of-order or delayed data.
- Collector CPU and memory saturation.
- Backend ingestion and query latency.
- Alert-evaluation delay.
- Dashboard and query errors.
- Storage growth and cardinality.
- Per-tenant cost and quota utilisation.
Synthetic telemetry can continuously traverse the complete path to prove that ingestion, storage, querying and alert delivery work end to end.
The platform should publish its own SLOs, status information and incident history. A green application dashboard is not credible if the telemetry pipeline is silently dropping half its data.
10. Security, privacy and compliance
Observability systems often contain production identifiers, stack traces, database statements and user-related data, making them security-sensitive.
Platform engineers implement:
- Encryption in transit and at rest.
- Workload identity and short-lived credentials.
- Role- and attribute-based access control.
- Tenant and environment isolation.
- Audit logs for access and configuration changes.
- Field-level redaction or tokenisation.
- Data-residency controls.
- Retention and legal-hold policies.
- Deletion workflows.
- Secure support access.
- Supply-chain controls for agents and collectors.
Redaction should occur as close to the source as practical. Once a secret reaches a replicated backend, caches, indexes and archives make reliable removal much harder.
11. Cost and capacity engineering
Telemetry volume can grow faster than application traffic because each request may emit multiple spans, log records and metric updates.
The platform team controls this through:
- Sampling.
- Aggregation.
- Filtering.
- Cardinality limits.
- Retention tiers.
- Compression.
- Query optimisation.
- Per-team budgets and quotas.
- Chargeback or showback.
- Storage lifecycle policies.
- Detection of unused dashboards and data.
The objective is value density: retain enough evidence to answer operational questions, rather than indiscriminately collecting everything.
Capacity plans account for normal growth and incident amplification. Failures can create log storms, retry storms and unusually large traces exactly when engineers most need the platform.
12. Reliability and operational ownership
The observability team operates the platform like any other critical distributed system. It performs:
- On-call response.
- Release and change management.
- Capacity planning.
- Load and failure testing.
- Backup and restoration testing.
- Regional failover exercises.
- Vulnerability and dependency management.
- Incident reviews.
- Performance tuning.
- Version and schema migrations.
Degraded modes are designed explicitly. For example, the platform may preserve high-severity logs and error traces while shedding low-value debug data during overload.
13. Typical division of responsibility
| Platform engineering owns | Application teams own |
|---|---|
| Collection and storage infrastructure | Correct service-specific instrumentation |
| SDKs, agents and golden paths | Business and user-journey semantics |
| Common telemetry schemas | Service-specific dimensions and events |
| SLO and alerting frameworks | Appropriate SLIs, SLO targets and alerts |
| Query, dashboard and correlation tooling | Diagnostic dashboards and runbooks |
| Security, retention and quotas | Avoiding sensitive or unbounded fields |
| Platform reliability and support | Responding to service alerts |
| Cost visibility and guardrails | Responsible telemetry consumption |
This boundary is important: the platform team provides reliable capabilities and paved roads, but it cannot infer every service’s user expectations or operational risks.
How the work is measured
Useful platform success measures include:
- Percentage of services using standard instrumentation.
- Percentage with valid ownership, SLIs and SLOs.
- Telemetry delivery success and end-to-end latency.
- Mean time to detect and diagnose incidents.
- Trace-context propagation coverage.
- Schema compliance and trace completeness.
- Alert precision and pages per on-call shift.
- Query success and latency.
- Time required to onboard a service.
- Telemetry cost per request, service or customer.
- User satisfaction among engineering teams.
The essential product is not a collection of dashboards. It is a dependable, governed and economical evidence system that helps engineers detect user impact, explain unfamiliar behaviour, identify root causes and recover safely.
AIOps in Observability
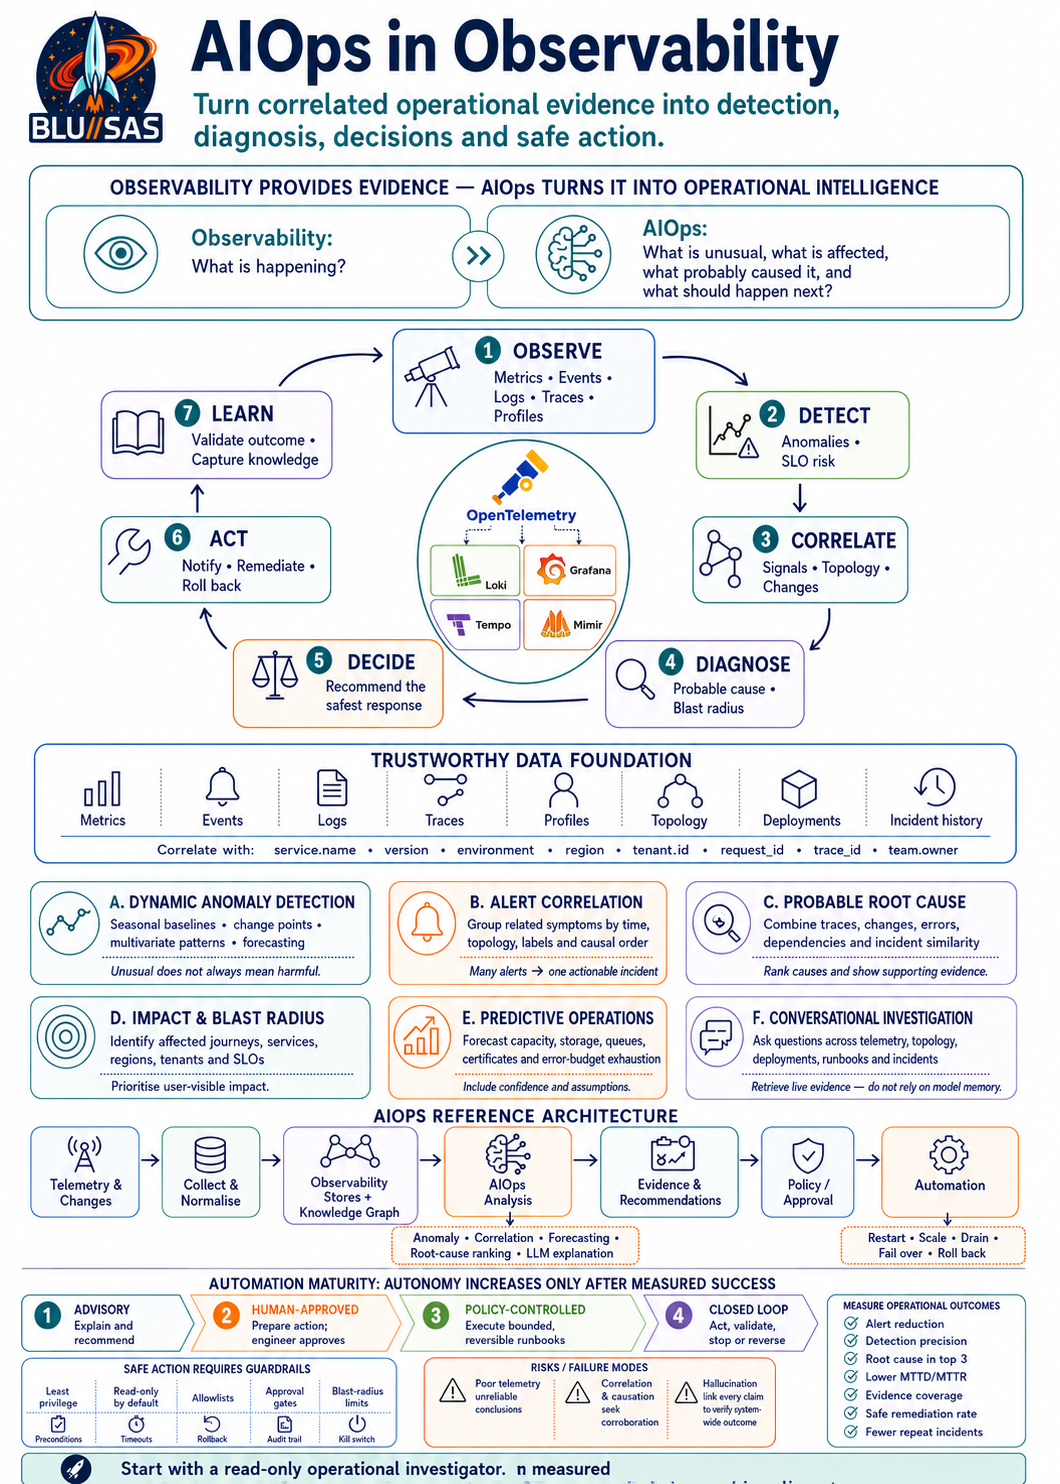
AIOps—Artificial Intelligence for IT Operations—uses statistical analysis, machine learning and generative AI to turn large volumes of observability data into operational decisions.
Traditional observability helps engineers ask:
“What is happening inside the system?”
AIOps goes further:
“What is unusual, what is affected, what probably caused it, what should we do next—and which actions are safe to automate?”
AIOps is therefore not a replacement for metrics, events, logs and traces. It is an intelligence and automation layer built on top of trustworthy, correlated telemetry.
The AIOps observability loop
flowchart TD
    A["Observe<br/>Metrics, events, logs, traces and profiles"] --> B["Detect<br/>Anomalies and SLO risk"]
    B --> C["Correlate<br/>Signals, topology and changes"]
    C --> D["Diagnose<br/>Probable root cause and impact"]
    D --> E["Decide<br/>Recommend or select an action"]
    E --> F["Act<br/>Notify, remediate or roll back"]
    F --> G["Learn<br/>Validate outcome and capture knowledge"]
    G --> A
The important word is loop. An AIOps system should observe the outcome of its action, verify that service health recovered and stop or reverse the action if conditions deteriorate.
The data foundation
Effective AIOps needs more than a collection of dashboards. It requires a common evidence model containing:
| Evidence | What it contributes |
|---|---|
| Metrics | Rates, latency, errors, saturation, capacity and SLI behaviour |
| Events | Deployments, configuration changes, failovers and lifecycle actions |
| Logs | Detailed errors, decisions, state changes and failure context |
| Traces | Request paths, dependencies, latency contribution and failure propagation |
| Profiles | CPU, memory, allocation, lock and code-level hotspots |
| Real-user telemetry | Actual user experience and client-side failures |
| Synthetic telemetry | Controlled journey and availability testing |
| Topology | Services, workloads, hosts, networks, databases and their relationships |
| Ownership metadata | Responsible team, escalation policy, repository and runbook |
| Change records | Commits, pipelines, releases, flags and infrastructure changes |
| Incident history | Previous symptoms, causes, mitigations and outcomes |
| Business context | Tenant, customer, product journey, revenue or priority |
These records must share identifiers such as:
service.name
service.version
deployment.environment.name
cluster
namespace
region
tenant.id
request_id
trace_id
span_id
deployment.id
team.owner
Without correlation, an AI model sees coincidental data. With correlation, it can construct a defensible incident narrative.
Principal AIOps capabilities
1. Dynamic anomaly detection
Static thresholds work for known limits:
CPU utilisation > 90%
error rate > 5%
queue depth > 10,000
They perform poorly when normal behaviour changes by hour, weekday, release cycle or traffic level.
AIOps can construct dynamic baselines using:
- Seasonal time-series models.
- Exponentially weighted statistics.
- Change-point detection.
- Forecasting.
- Multivariate anomaly detection.
- Clustering and density estimation.
- Isolation-based models.
- Neural time-series models.
A simplified anomaly score might be:At=σt∣xt−x^t∣
where xt is the observed value, x^t is the expected value and σt represents expected variation.
A high score means “unusual,” not necessarily “bad.” A nightly batch job may be highly unusual but intentional. Production alerting must combine anomalies with SLO risk, user impact and operational context.
2. Alert correlation and noise reduction
One infrastructure failure can generate hundreds of alerts:
Node failure
 ├── Pod unavailable
 ├── Endpoint missing
 ├── Request errors
 ├── Queue growth
 ├── Retry increase
 ├── Downstream timeout
 └── SLO burn alert
AIOps groups alerts into an incident using evidence such as:
- Temporal proximity.
- Shared resources or services.
- Dependency relationships.
- Common labels.
- Similar error messages.
- Causal ordering.
- Shared deployment or configuration changes.
- Historical co-occurrence.
The goal is event compression:Compression ratio=1−raw alertsactionable incidents
A high compression ratio is useful only if the system does not suppress distinct or user-visible failures.
3. Probable root-cause analysis
AIOps attempts to identify the earliest or most explanatory condition in an incident.
Useful approaches include:
- Dependency-graph traversal.
- Temporal precedence analysis.
- Change correlation.
- Trace critical-path analysis.
- Statistical causality tests.
- Bayesian inference.
- Historical incident similarity.
- Log-pattern clustering.
- Knowledge-graph reasoning.
For example:
- Checkout latency increases.
- Traces show most additional time in the payment call.
- Payment latency began two minutes after version
4.8.2was deployed. - Logs show connection-pool exhaustion in that version.
- Other consumers of the database remain healthy.
- Rollback of
4.8.2previously resolved the same signature.
The system can present:
Probable cause: payment-service deployment 4.8.2
Confidence: 0.87

Evidence:
- symptom began 2m 14s after deployment
- 91% of slow checkout traces wait in payment-service
- new connection-pool exhaustion signature
- database health remains normal
- matches incident INC-1842
The evidence is more important than the confidence number. Engineers must be able to inspect why the system reached its conclusion.
4. Service-impact and blast-radius analysis
AIOps uses service topology and trace relationships to determine which users and systems are affected.
It may answer:
- Which customer journeys are failing?
- Is the failure regional or global?
- Which tenants are affected?
- Which downstream services depend on the failing component?
- Is this internal degradation or externally visible impact?
- Which SLOs and error budgets are at risk?
- How many requests or users were affected?
This distinguishes a critical incident from a noisy internal anomaly.
5. Predictive operations
Forecasting models can identify future operational risks such as:
- Storage exhaustion.
- Capacity saturation.
- Error-budget depletion.
- Certificate expiration.
- Queue growth.
- Memory leakage.
- Increasing query latency.
- Approaching API quotas.
- Hardware failure indicators.
Time-to-exhaustion can be estimated from the current value and forecast growth:Texhaustion≈forecast growth ratecapacity−current usage
Forecasts should include uncertainty. “Disk full in 14 days” is less useful than:
Predicted exhaustion: 12–17 days
Confidence: 90%
Assumptions: current ingestion and retention remain unchanged
6. Generative-AI investigation
Large language models provide a conversational interface over operational evidence. Engineers can ask:
- “Why did checkout latency increase after 14:20?”
- “What changed immediately before the incident?”
- “Show the traces responsible for the SLO burn.”
- “Which customer-facing services depend on this database?”
- “Have we seen this failure signature before?”
- “Summarise the incident for the network team.”
- “What is the safest verified remediation?”
The model can translate the question into controlled calls to:
- Metrics queries.
- Log searches.
- Trace lookups.
- Service-catalogue queries.
- Kubernetes and cloud APIs.
- CI/CD history.
- Configuration repositories.
- Incident systems.
- Runbooks and knowledge bases.
The model should retrieve live evidence through tools rather than relying on its pretrained memory.
Reference architecture
flowchart TD
    A["Telemetry and operational systems"] --> B["Collection and normalisation"]
    B --> C["Observability stores"]
    B --> D["Topology and knowledge graph"]
    C --> E["AIOps analysis services"]
    D --> E
    F["Deployments, incidents and runbooks"] --> D
    E --> G["Evidence and recommendations"]
    G --> H["Engineer or incident commander"]
    G --> I["Policy and approval engine"]
    I --> J["Automation and remediation"]
    J --> A
Analysis services
The intelligence layer may contain separate components for:
- Anomaly detection.
- Forecasting.
- Alert correlation.
- Log-template extraction.
- Trace analysis.
- Topology reasoning.
- Incident similarity.
- Root-cause ranking.
- Natural-language explanation.
- Remediation planning.
Using specialist models is often safer and cheaper than asking one general-purpose language model to perform every function.
Knowledge graph
A knowledge graph captures relationships such as:
service → runs_on → cluster
service → owned_by → team
service → depends_on → database
service → calls → downstream_service
deployment → changed → service
alert → affects → service
incident → resolved_by → runbook
This gives AI a structured operational map and reduces dependence on guesses derived from text.
Tool gateway
The tool gateway exposes narrowly defined operations such as:
query_metrics()
search_logs()
get_trace()
get_deployment()
get_service_dependencies()
retrieve_runbook()
restart_workload()
rollback_release()
scale_service()
Each tool should have a typed schema, permissions, timeouts, result limits and audit logging. Read-only diagnostic tools should be separated from state-changing actions.
MCP can provide a standard interface between an AI assistant and these observability, infrastructure and knowledge systems.
Remediation and automation
AIOps maturity usually progresses through four operating modes.
Advisory
The system explains evidence and suggests actions. A human decides and executes.
Recommendation: roll back payment-service to 4.8.1
Reason: 4.8.2 introduced a matching failure signature
Human-approved execution
The AI prepares a specific action, but an authorised engineer approves it.
Proposed action:
rollback deployment/payment-service
from 4.8.2 to 4.8.1
in production-eu-west

Expected impact:
temporary reduction of two ready replicas

Approval required: Incident Commander
Policy-controlled automation
The system automatically performs predefined, reversible actions when evidence meets strict conditions.
Examples include:
- Restarting an unhealthy replica.
- Scaling a saturated worker pool.
- Draining a failing node.
- Disabling a problematic feature flag.
- Failing over to a healthy region.
- Rolling back a verified bad deployment.
Autonomous closed-loop operation
The system selects, performs and validates remediation with limited human involvement. This should be reserved for well-understood failure modes with strong guardrails.
A safe automated workflow is:
flowchart TD
    A["Detect user-impact risk"] --> B["Gather corroborating evidence"]
    B --> C["Select approved runbook"]
    C --> D{"Policy permits action?"}
    D -- No --> E["Escalate with evidence"]
    D -- Yes --> F["Execute bounded action"]
    F --> G["Observe health and SLOs"]
    G --> H{"Recovery verified?"}
    H -- Yes --> I["Record outcome"]
    H -- No --> J["Stop, reverse and escalate"]
Guardrails
AIOps should never turn uncertain diagnosis into unlimited production authority.
Required controls include:
- Least-privilege identities.
- Read-only operation by default.
- Environment and resource allowlists.
- Human approval for high-impact actions.
- Maximum action frequency.
- Concurrency and blast-radius limits.
- Maintenance-window awareness.
- Preconditions and postconditions.
- Idempotent operations.
- Timeouts and circuit breakers.
- Rollback plans.
- Complete audit trails.
- Separation of diagnosis, approval and execution.
- Emergency kill switch.
For example, an automated scaling tool might be constrained to:
Environment: production
Resource type: stateless Kubernetes deployment
Maximum increase: 25%
Minimum healthy replicas: 3
Cooldown: 15 minutes
Maximum actions: 2 per incident
Rollback: restore previous replica count
Challenges and failure modes
Poor telemetry quality
Missing service names, inconsistent timestamps, unstructured logs and broken trace propagation produce unreliable analysis. AI does not repair an absent evidence model.
Correlation mistaken for causation
A deployment shortly before an incident is suspicious, but it is not automatically the cause. AIOps should seek corroboration from traces, errors, topology and comparative control groups.
Hallucinated explanations
Generative models can create convincing narratives unsupported by telemetry. Every important claim should be linked to a query result, trace, event, configuration change or approved knowledge source.
Model drift
Traffic patterns, system architecture and deployment practices change. Baselines and models must be monitored, retrained and evaluated.
Automation feedback loops
An AI that reacts to CPU by scaling may increase database pressure, trigger more retries and worsen the incident. Remediation must consider system-wide dependencies and validate outcomes.
Sensitive information
Logs and traces may contain secrets or personal data. Retrieval, prompts, model inputs and stored conversations require the same access controls and retention policies as the underlying telemetry.
Over-automation
Automating an unstable manual process usually makes the failure faster. First standardise the runbook, make it deterministic and test rollback behaviour.
Measuring AIOps effectiveness
Useful measures include:
- Alert reduction and incident-compression ratio.
- Precision and recall of anomaly detection.
- False-positive and false-negative rates.
- Root cause appearing in the top three suggestions.
- Time to detect, acknowledge, diagnose and recover.
- Percentage of conclusions supported by linked evidence.
- Recommendation acceptance rate.
- Successful automated-remediation rate.
- Rollback and unsafe-action rate.
- Engineer time saved.
- Reduction in repeated incidents.
- SLO and error-budget improvement.
An AIOps platform should be evaluated on operational outcomes, not on how fluent its summaries sound.
Practical maturity path
A sensible adoption sequence is:
- Standardise service identity and telemetry schemas.
- Correlate MELT, deployments, topology and ownership.
- Improve SLO-based alerting and reduce existing noise.
- Add dynamic anomaly detection and forecasting.
- Group related alerts into incidents.
- Introduce evidence-backed AI investigation.
- Retrieve approved runbooks and recommend actions.
- Permit human-approved execution.
- Automate low-risk, reversible responses.
- Expand autonomy only from measured success.
For an observability platform, the best initial AIOps implementation is usually a read-only operational investigator. It queries live telemetry, correlates changes and dependencies, retrieves previous incidents, ranks probable causes and produces an evidence-linked diagnosis. Once that behaviour is reliable, it can progress toward controlled remediation.