This infographic is designed to answer a common senior Linux/SRE interview question:
“Explain how the Linux kernel works, when you would recompile it, and how kernel modules work.”
An interviewer is not looking for someone who can merely run uname -r. They want to know whether you understand the architecture of Linux, how user space interacts with the kernel, how extensibility works, and when low-level kernel engineering becomes necessary.
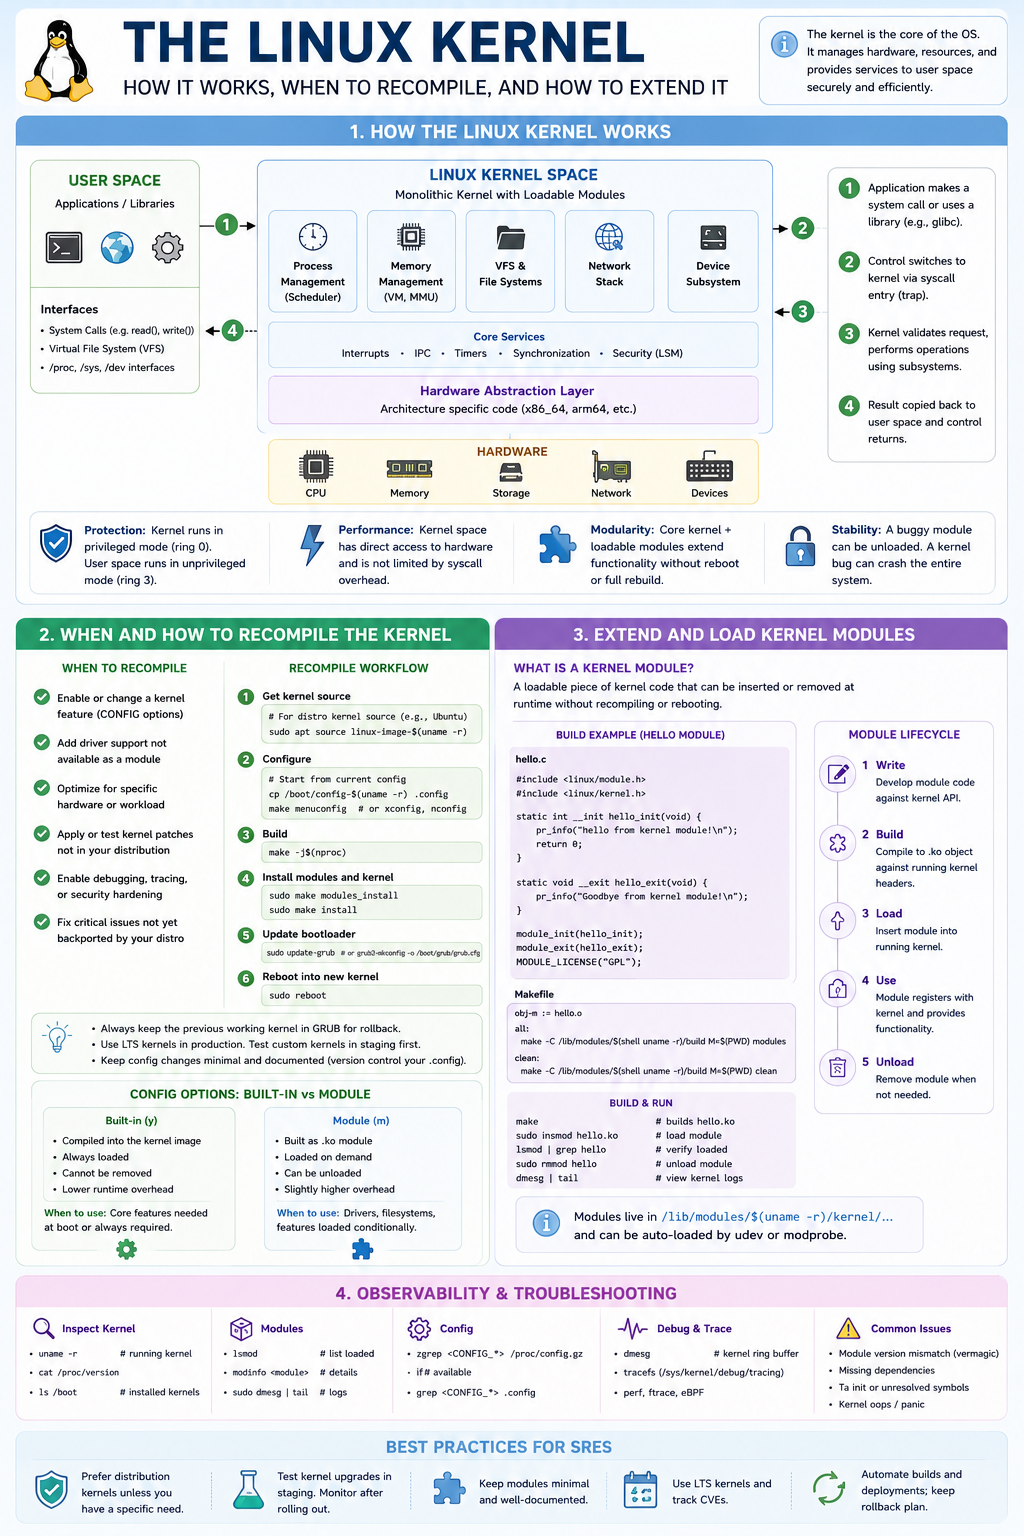
1. How the Linux Kernel Works
The top section shows the fundamental Linux architecture.
User Space
Applications run in user mode (Ring 3):
Examples:
- bash
- nginx
- postgres
- python
- kubectl
- systemd services
These applications:
- Cannot access hardware directly
- Cannot access kernel memory
- Cannot execute privileged CPU instructions
Instead they must ask the kernel for help.
System Call Flow
The numbered arrows show the most important concept.
Step 1
Application requests an OS service.
Examples:
open()
read()
write()
socket()
fork()
Step 2
CPU performs a privilege transition.
User mode:
Ring 3Kernel mode:
Ring 0This is called:
- syscall
- trap
- context switch to kernel
Step 3
Kernel executes the operation.
The request is routed through kernel subsystems:
- Scheduler
- Memory manager
- VFS
- Network stack
- Device drivers
Step 4
Result returned to user space.
Example:
fd = open("/etc/passwd")Kernel:
- locates filesystem
- checks permissions
- accesses storage
- returns file descriptor
Linux Kernel Components
The center block shows the major subsystems.
Scheduler
Responsible for:
Which process runs?
For how long?
On which CPU?
Examples:
- CFS scheduler
- Real-time scheduling
SRE relevance:
High CPU troubleshooting often involves scheduler analysis.
Tools:
top
pidstat
perf
Memory Management
Responsible for:
- Virtual memory
- Page allocation
- NUMA
- Caching
- Swapping
Examples:
free -h
vmstat
sar
SREs frequently troubleshoot:
- OOM kills
- Memory leaks
- Swap storms
VFS (Virtual File System)
Provides common interface to:
ext4
xfs
btrfs
nfs
cephfs
Application sees:
open()
read()
write()
Kernel translates to filesystem-specific operations.
Network Stack
Handles:
TCP
UDP
IP
ARP
ICMP
Examples:
ss
netstat
tcpdump
In Kubernetes this becomes even more important.
Device Drivers
Hardware abstraction layer.
Examples:
NIC driver
GPU driver
NVMe driver
RAID controller
Without drivers Linux cannot talk to hardware.
Hardware Abstraction Layer (HAL)
This layer isolates architecture-specific code.
Examples:
x86_64
ARM64
PowerPC
This allows Linux to run on:
- Raspberry Pi
- Cloud VMs
- Supercomputers
- AI clusters
using largely the same kernel code.
Why Kernel Space Is Powerful
The infographic highlights four key reasons.
Protection
Kernel owns:
- Hardware
- Memory
- Interrupts
Applications are isolated.
This is fundamental to Linux security.
Performance
Kernel accesses hardware directly.
No userspace mediation.
Critical operations:
- Scheduling
- Networking
- Storage
execute extremely fast.
Modularity
Linux is not fully static.
Features can be added dynamically using:
Kernel Moduleswithout rebooting.
Stability
A kernel bug is catastrophic.
Examples:
Kernel panic
Driver crash
Memory corruption
Unlike user-space crashes, these can bring down the entire system.
2. When and How to Recompile the Kernel
Most SREs rarely compile kernels.
Interviewers want to know:
When would you need to?
Reasons to Recompile
Enable new feature
Example:
eBPF feature
filesystem
security module
Add hardware support
Example:
New NIC
GPU
Storage controller
Performance tuning
Examples:
HPC cluster
Low-latency trading
AI infrastructure
Custom kernel options can reduce overhead.
Security hardening
Examples:
SELinux
LSM
Kernel lockdown
Test patches
Before upstream distribution release.
Kernel Rebuild Workflow
1. Obtain Source
Distribution source:
apt source linux-image-$(uname -r)or
git clone https://git.kernel.org2. Configure
Copy existing config:
cp /boot/config-$(uname -r) .configThen:
make menuconfigor
make xconfig3. Build
make -j$(nproc)This compiles:
- kernel image
- modules
4. Install
make modules_install
make install
5. Update Bootloader
update-grub6. Reboot
Boot new kernel.
CONFIG Options
One interview favourite.
Built-In (Y)
Compiled directly into kernel.
Example:
CONFIG_EXT4_FS=yPros:
- Always available
- Faster
Cons:
- Requires reboot
- Cannot unload
Module (M)
Built as:
.ko filePros:
- Dynamic
- Load/unload
Cons:
- Small runtime overhead
3. Kernel Modules
This is the extensibility mechanism.
What Is a Kernel Module?
A dynamically loadable piece of kernel code.
Extension without rebuilding the kernel.
Examples:
GPU driver
Filesystem
Network driver
eBPF helpers
Module Lifecycle
Write
Create C code using kernel APIs.
Build
Compile against kernel headers.
Load
insmod module.koor
modprobe moduleUse
Kernel registers functionality.
Examples:
Driver
Filesystem
Network protocol
Unload
rmmod moduleCommon Module Commands
Interviewers often expect these.
List loaded modules
lsmodShow module info
modinfo e1000eLoad
modprobe nvmeRemove
rmmod nvmeModule Build Example
The infographic shows the classic:
hello.cmodule.
Important concepts:
Entry point
module_init()Runs when loaded.
Exit point
module_exit()Runs when unloaded.
Kernel logging
pr_info()Outputs to:
dmesg4. Observability & Troubleshooting
Critical SRE knowledge.
Running Kernel
uname -rInstalled Kernels
ls /bootView Config
zgrep CONFIG_ /proc/config.gzKernel Messages
dmesgShows:
- driver errors
- hardware faults
- kernel warnings
Tracing
Modern systems:
perf
ftrace
eBPF
Used to observe:
- scheduling
- syscalls
- networking
- storage
without modifying applications.
Common Interview Questions This Infographic Answers
Explain kernel space vs user space.
Answer:
Applications run in Ring 3 and use syscalls to request services from the Ring 0 kernel.
What is a kernel module?
Answer:
A dynamically loadable extension (.ko) that adds functionality without rebuilding the kernel.
Difference between built-in and module?
Answer:
Built-in = compiled into kernel
Module = loaded dynamically
When would you recompile a kernel?
Answer:
- Enable features
- Hardware support
- Security hardening
- Performance tuning
- Testing patches
How would you troubleshoot kernel issues?
Answer:
dmesg
journalctl -k
lsmod
modinfo
perf
ftrace
eBPF
and correlate kernel events with application symptoms.
What a Senior SRE Should Emphasize
For an SRE interview, the strongest answer is:
“Linux is a monolithic kernel with loadable modules. User-space applications interact with kernel subsystems through system calls. The kernel manages CPU scheduling, memory, filesystems, networking and devices. Most production systems use distribution kernels, but for HPC and AI environments we sometimes enable custom features, optimize scheduling, tune NUMA behaviour, or add hardware support through kernel configuration and modules. For observability, modern systems increasingly use perf, ftrace and eBPF to inspect kernel behaviour without requiring kernel recompilation or application changes.”
That answer demonstrates operating system fundamentals, production operations experience, and awareness of modern observability techniques.
Many engineers know:
“VMs virtualise hardware, containers virtualise applications.”
But a senior SRE should understand exactly how the kernel behaves in each environment.
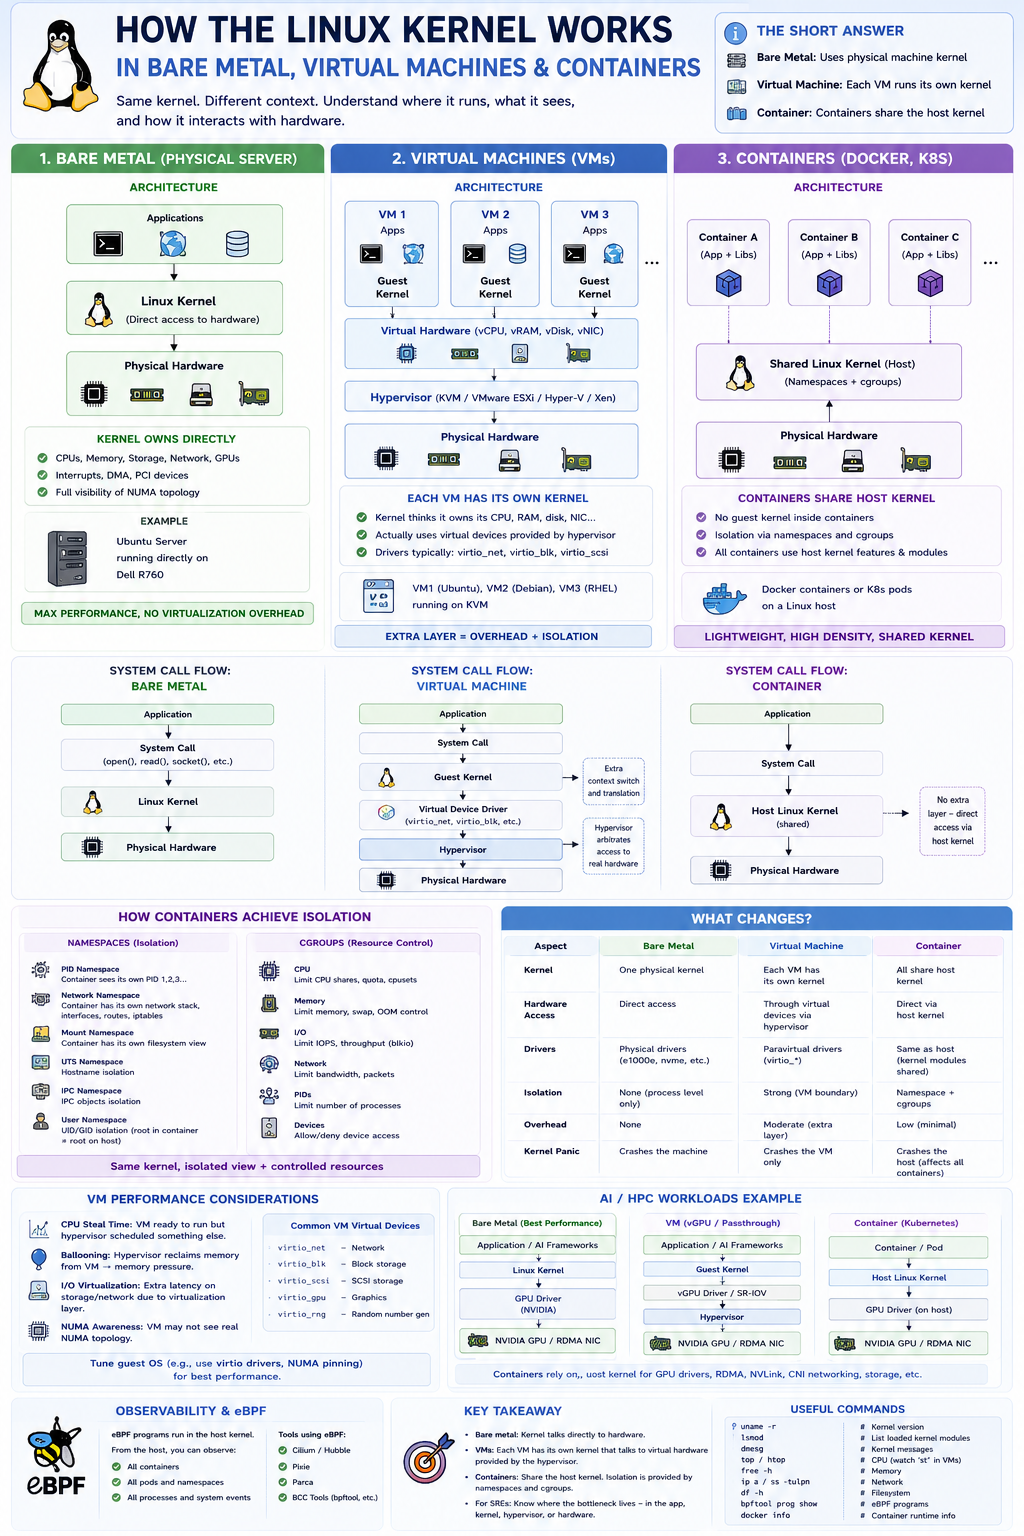
The Short Answer
There are actually three different models:
| Environment | Kernel |
|---|---|
| Bare Metal | Uses physical machine kernel |
| Virtual Machine | Each VM runs its own kernel |
| Container | Containers share the host kernel |
This is the most important distinction.
1. Bare Metal Linux
Architecture
+-------------------------+
| Applications            |
+-------------------------+
| Linux Kernel            |
+-------------------------+
| Physical Hardware       |
+-------------------------+
Example:
Ubuntu Server
running directly on
Dell R760
The Linux kernel owns:
- CPUs
- Memory
- Storage
- Network cards
- GPUs
- Interrupts
directly.
System Calls
Application:
read()
write()
socket()
fork()
↓
Linux Kernel
↓
Physical Hardware
No intermediary exists.
Advantages
Maximum performance.
No virtualization overhead.
Direct access to:
- NUMA topology
- PCI devices
- GPUs
- RDMA NICs
Disadvantages
Poor isolation.
One kernel panic affects entire machine.
2. Virtual Machines
This is where things become interesting.
Architecture
+---------------------+
| App                 |
+---------------------+
| Guest Linux Kernel  |
+---------------------+
| Virtual Hardware    |
+---------------------+
| Hypervisor          |
+---------------------+
| Host Hardware       |
+---------------------+
Example:
KVM
VMware ESXi
Hyper-V
Xen
Each VM Has Its Own Kernel
This is the key concept.
Imagine:
VM1 -> Ubuntu Kernel
VM2 -> Debian Kernel
VM3 -> RHEL Kernel
Each kernel thinks it owns:
CPU
RAM
Disk
NIC
but the hardware is fake.
Example
VM sees:
eth0Actually:
Virtual NIC
↓
VirtIO
↓
Hypervisor
↓
Physical NIC
System Call Flow in VM
Bare Metal:
Application
↓
Kernel
↓
Hardware
VM:
Application
↓
Guest Kernel
↓
Virtual Device
↓
Hypervisor
↓
Physical Device
Extra layer exists.
Why Hypervisors Exist
Hypervisor provides:
CPU virtualization
Creates virtual CPUs (vCPUs).
Memory virtualization
Creates guest physical memory.
Actually maps to host memory.
Device virtualization
Presents:
vNIC
vDisk
vGPU
to VM.
VM Kernel Responsibilities
Inside the VM the kernel still performs:
Scheduling
Process A
Process B
on guest CPUs.
Memory management
Page tables.
Virtual memory.
NUMA awareness.
Networking
TCP/IP stack.
iptables.
eBPF.
Filesystems
ext4
xfs
btrfs
etc.
What Changes?
Kernel cannot directly touch hardware.
Instead:
Guest Kernel
↓
VirtIO Driver
↓
Hypervisor
↓
Real Hardware
VM Performance Challenges
Senior SREs should understand:
CPU Steal Time
Huge interview topic.
Example:
topshows:
st = 20%Meaning:
VM wanted CPU but hypervisor scheduled another VM instead.
Ballooning
Hypervisor reclaims memory.
Guest sees memory pressure.
Virtual I/O
Storage and network latency may be caused by hypervisor.
Not Linux itself.
VM Kernel Modules
Guest kernels load modules normally.
Example:
modprobe nvmeBut hardware modules often become:
virtio_blk
virtio_net
virtio_scsi
instead of physical drivers.
3. Containers
This is where many people get confused.
Containers Do NOT Have Their Own Kernel
This is the biggest difference.
Architecture:
+---------------------+
| Container A         |
+---------------------+

+---------------------+
| Container B         |
+---------------------+

+---------------------+
| Container C         |
+---------------------+

========================
Shared Linux Kernel
========================

Host Hardware
All containers share one kernel.
Example
Host:
uname -rreturns:
6.8.0Container:
uname -rreturns:
6.8.0same kernel.
Why?
Docker image contains:
Application
Libraries
Filesystem
but NOT:
Linux KernelContainer System Call Flow
Application:
open()
read()
socket()
↓
Host Linux Kernel
↓
Hardware
No guest kernel exists.
How Containers Achieve Isolation
Kernel features provide separation.
Namespaces
Make process believe it owns resources.
PID Namespace
Container sees:
PID 1
PID 2
PID 3
even though host has:
PID 45678Network Namespace
Container sees:
eth0Actually:
veth pair
↓
bridge
↓
host network
Mount Namespace
Container sees:
/which is not host filesystem.
cgroups
Resource control.
Examples:
CPU limits
Memory limits
IO limits
Container Memory
Kernel memory is shared.
Only process memory is isolated.
Container Scheduling
Host kernel scheduler manages everything.
Example:
Container A process
Container B process
Host process
all scheduled by same kernel.
Container Networking
Kernel network stack shared.
Container:
eth0
↓
veth
↓
CNI
↓
Host kernel
↓
Physical NIC
eBPF in Containers
Important modern interview topic.
eBPF runs in:
Host Kernelnot inside container.
Therefore eBPF can observe:
All containers
All pods
All processes
simultaneously.
This is why:
- Cilium
- Hubble
- Pixie
- Parca
are so powerful.
Kubernetes
Kubernetes simply adds orchestration.
Architecture:
Pod
 ├─ Container A
 └─ Container B

Shared Host Kernel
All pods on node use:
Node Linux KernelGPU / AI Workloads
This becomes extremely important.
Bare Metal AI Cluster
Application
↓
Linux Kernel
↓
GPU Driver
↓
NVIDIA GPU
Lowest latency.
Highest performance.
VM-based AI
Application
↓
Guest Kernel
↓
vGPU / Passthrough
↓
Hypervisor
↓
GPU
Additional complexity.
Kubernetes AI
Container
↓
Host Kernel
↓
NVIDIA Kernel Module
↓
GPU
Container does not own GPU driver.
Host kernel does.
HPC Perspective
Historically:
Supercomputersused:
Bare Metal Linuxbecause:
- lowest latency
- best NUMA awareness
- direct InfiniBand access
Modern AI clusters increasingly use:
Kubernetesbut still rely on:
Host Linux Kernelfor:
- RDMA
- GPUDirect
- NVLink
- GPU drivers
Interview Answer (Senior SRE Level)
A strong answer is:
“The Linux kernel behaves differently depending on the isolation model. On bare metal the kernel directly controls hardware. In a VM, each guest runs its own kernel and interacts with virtual devices provided by the hypervisor, which ultimately maps operations to physical hardware. In containers there is no guest kernel; all containers share the host kernel and isolation is provided through namespaces and cgroups. This distinction is critical for troubleshooting because performance issues may originate in the guest kernel, hypervisor layer, or shared host kernel. For Kubernetes and AI workloads, understanding how the host kernel manages scheduling, networking, storage, GPUs, RDMA, and eBPF observability is essential for effective performance analysis.”
That answer demonstrates operating system fundamentals, virtualization knowledge, container internals, and modern Kubernetes/HPC awareness.
Linux Performance Monitoring and Troubleshooting
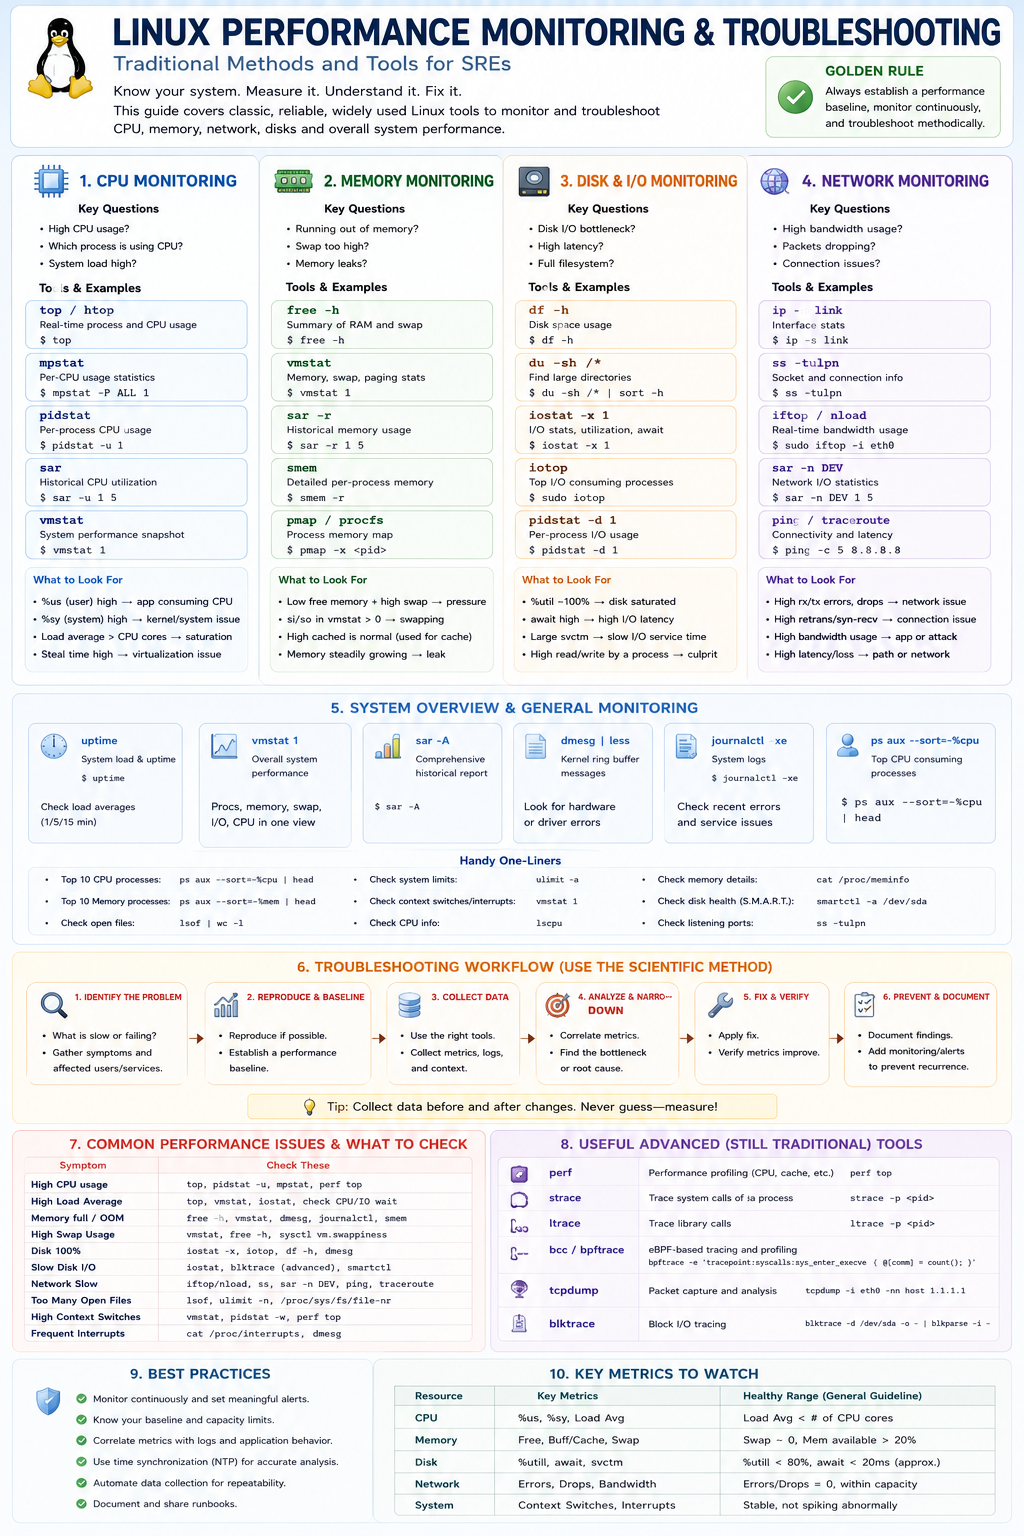
This infographic is essentially a Linux performance troubleshooting playbook for SREs, SysAdmins, Platform Engineers, and HPC/AI engineers. It presents a structured methodology for diagnosing performance issues using traditional Linux tools before moving to advanced tracing technologies such as eBPF.
The key message is:
Measure first, identify the bottleneck, collect evidence, then fix. Never guess.
Overall Structure
The infographic breaks Linux performance troubleshooting into:
- CPU Monitoring
- Memory Monitoring
- Disk & I/O Monitoring
- Network Monitoring
- System-wide Monitoring
- Troubleshooting Methodology
- Common Problems
- Advanced Traditional Tools
- Best Practices
- Key Metrics to Watch
1. CPU Monitoring
This section focuses on answering:
Is the CPU the bottleneck?
Which process is consuming it?
Is the kernel or application responsible?
top / htop
Most common starting point.
top
htop
Shows:
- CPU utilisation
- Running processes
- Load average
- Memory
Look at:
%us = User CPU
%sy = Kernel CPU
%wa = IO wait
%st = Steal time
Example
High:
%us = 90%Usually means:
- Application consuming CPU
Example:
Python
Java
TensorFlow
High:
%sy = 80%Usually means:
- Kernel activity
- Networking
- Filesystem
- Interrupts
mpstat
Per-core CPU visibility.
mpstat -P ALL 1Useful for:
- NUMA systems
- AI nodes
- HPC nodes
Looking for:
One CPU saturated
Others idle
pidstat
Per-process statistics.
pidstat -u 1Answers:
Which process is consuming CPU?Load Average
Many candidates misunderstand load.
uptimeShows:
1 min
5 min
15 min
Example:
Load = 128
CPU = 64
System overloaded.
2. Memory Monitoring
Questions:
Running out of RAM?
Swapping?
Memory leaks?
OOM?
free -h
Quick RAM overview.
free -hShows:
- Used
- Free
- Available
- Swap
Modern Linux:
Focus on:
Availablenot “Free”.
vmstat
Excellent overall memory indicator.
vmstat 1Watch:
si
so
Meaning:
Swap In
Swap Out
Non-zero values often indicate memory pressure.
smem
Detailed memory breakdown.
Useful for:
RSS
PSS
USS
analysis.
pmap
Per-process memory map.
pmap -x <pid>Useful when:
Application memory leak suspectedMemory Problems
Watch for:
High swap
System slow
High latency
OOM Killer
Kernel starts killing processes.
Check:
dmesg
journalctl
3. Disk & I/O Monitoring
Questions:
Storage bottleneck?
Slow database?
Slow filesystem?
df -h
Filesystem capacity.
df -hAnswers:
Disk full?du
Find large directories.
du -sh /*iostat
One of the most important Linux commands.
iostat -x 1Watch:
%util
100%Disk saturated.
await
High:
20ms
100ms
500ms
Indicates storage latency.
svctm
Service time.
iotop
Top-like interface for disk users.
iotopAnswers:
Who is hammering storage?pidstat -d
Per-process disk usage.
pidstat -d 1Useful when:
Database
Backup
AI training job
is generating excessive I/O.
4. Network Monitoring
Questions:
Packet drops?
Bandwidth issues?
Connectivity problems?
ip link
Interface status.
ip -s linkShows:
- RX
- TX
- Errors
- Drops
ss
Modern replacement for netstat.
ss -tulpnShows:
- Listening ports
- Connections
- Processes
iftop / nload
Bandwidth consumers.
iftop
nload
Answers:
Who is using the network?sar -n DEV
Historical network metrics.
sar -n DEV 1ping
Basic connectivity.
ping 8.8.8.8traceroute
Path analysis.
tracerouteUseful for:
- WAN issues
- Cloud networking
- Inter-DC latency
Network Troubleshooting Clues
High:
RX/TX dropsUsually:
- Congestion
- Driver issue
- MTU mismatch
High retransmissions:
TCP retriesUsually:
- Packet loss
- Congested links
5. System Overview
These tools provide overall health.
uptime
Shows:
Load Averagevmstat
Single-pane view of:
CPU
Memory
IO
Context switches
sar
Historical performance.
sar -AOne of the most powerful Linux troubleshooting tools.
dmesg
Kernel ring buffer.
dmesgLook for:
Driver errors
Storage failures
OOM events
Hardware faults
journalctl
System logs.
journalctl -xeUseful for:
Services
Kernel
Systemd
issues.
Handy One-Liners
The infographic includes common commands.
Top CPU processes:
ps aux --sort=-%cpu | headTop memory consumers:
ps aux --sort=-%mem | headOpen files:
lsofCPU information:
lscpuMemory details:
cat /proc/meminfoListening ports:
ss -tulpn6. Troubleshooting Workflow
This is arguably the most important section.
The infographic promotes the Scientific Method.
Step 1
Identify problem.
Ask:
What is slow?
Who is affected?
Step 2
Establish baseline.
Compare:
Working state
vs
Broken state
Step 3
Collect data.
Gather:
Metrics
Logs
System state
Step 4
Analyze.
Correlate:
CPU
Memory
Network
Storage
Step 5
Fix.
Apply change.
Step 6
Verify.
Confirm improvement.
Step 7
Document.
Create:
- Runbook
- Knowledge article
- Alert
7. Common Issues
The infographic maps symptoms to tools.
Examples:
| Problem | Tools |
|---|---|
| High CPU | top, mpstat, pidstat |
| High Load | top, vmstat, iostat |
| OOM | free, vmstat, dmesg |
| Disk Full | df, du |
| Slow Storage | iostat, iotop |
| Slow Network | iftop, sar, ping |
| Too Many Files | lsof |
| Interrupt Storm | vmstat, cat /proc/interrupts |
8. Advanced Traditional Tools
Before eBPF became mainstream, these were the power tools.
perf
CPU profiling.
perf topFinds:
Hot functions
Kernel hotspots
strace
System call tracing.
strace -p PIDShows:
open()
read()
write()
connect()
ltrace
Library call tracing.
Shows:
glibc
libssl
calls.
tcpdump
Packet capture.
tcpdump -i eth0Network troubleshooting gold standard.
blktrace
Storage tracing.
Useful for:
Deep IO analysis9. Best Practices
Important SRE principles:
Know your baseline
You cannot identify anomalies without knowing normal behaviour.
Correlate metrics
Don’t view CPU alone.
Example:
High CPU
+
High IO wait
=
Storage issue
Synchronize clocks
Use:
NTP
Chrony
for accurate correlation.
Automate collection
Use:
- Prometheus
- Grafana
- Zabbix
- Datadog
10. Key Metrics To Watch
The infographic ends with the most important metrics.
CPU
Watch:
%user
%system
Load average
Memory
Watch:
Available memory
Swap
Disk
Watch:
%util
await
svctm
Network
Watch:
Bandwidth
Errors
Drops
Retransmissions
System
Watch:
Context switches
Interrupts
What an Interviewer Is Looking For
When an SRE interviewer asks:
“How do you troubleshoot Linux performance issues?”
They are usually looking for this structured answer:
- Establish symptoms and impact.
- Check overall health (
uptime,vmstat,top). - Determine bottleneck domain:
- CPU
- Memory
- Disk
- Network
- Use specialist tools:
pidstatiostatiftopss
- Correlate metrics with logs (
journalctl,dmesg). - Form a hypothesis.
- Validate before making changes.
- Measure again after remediation.
That methodology is often valued more highly than memorizing every command. The strongest SREs are systematic investigators rather than command encyclopedias.
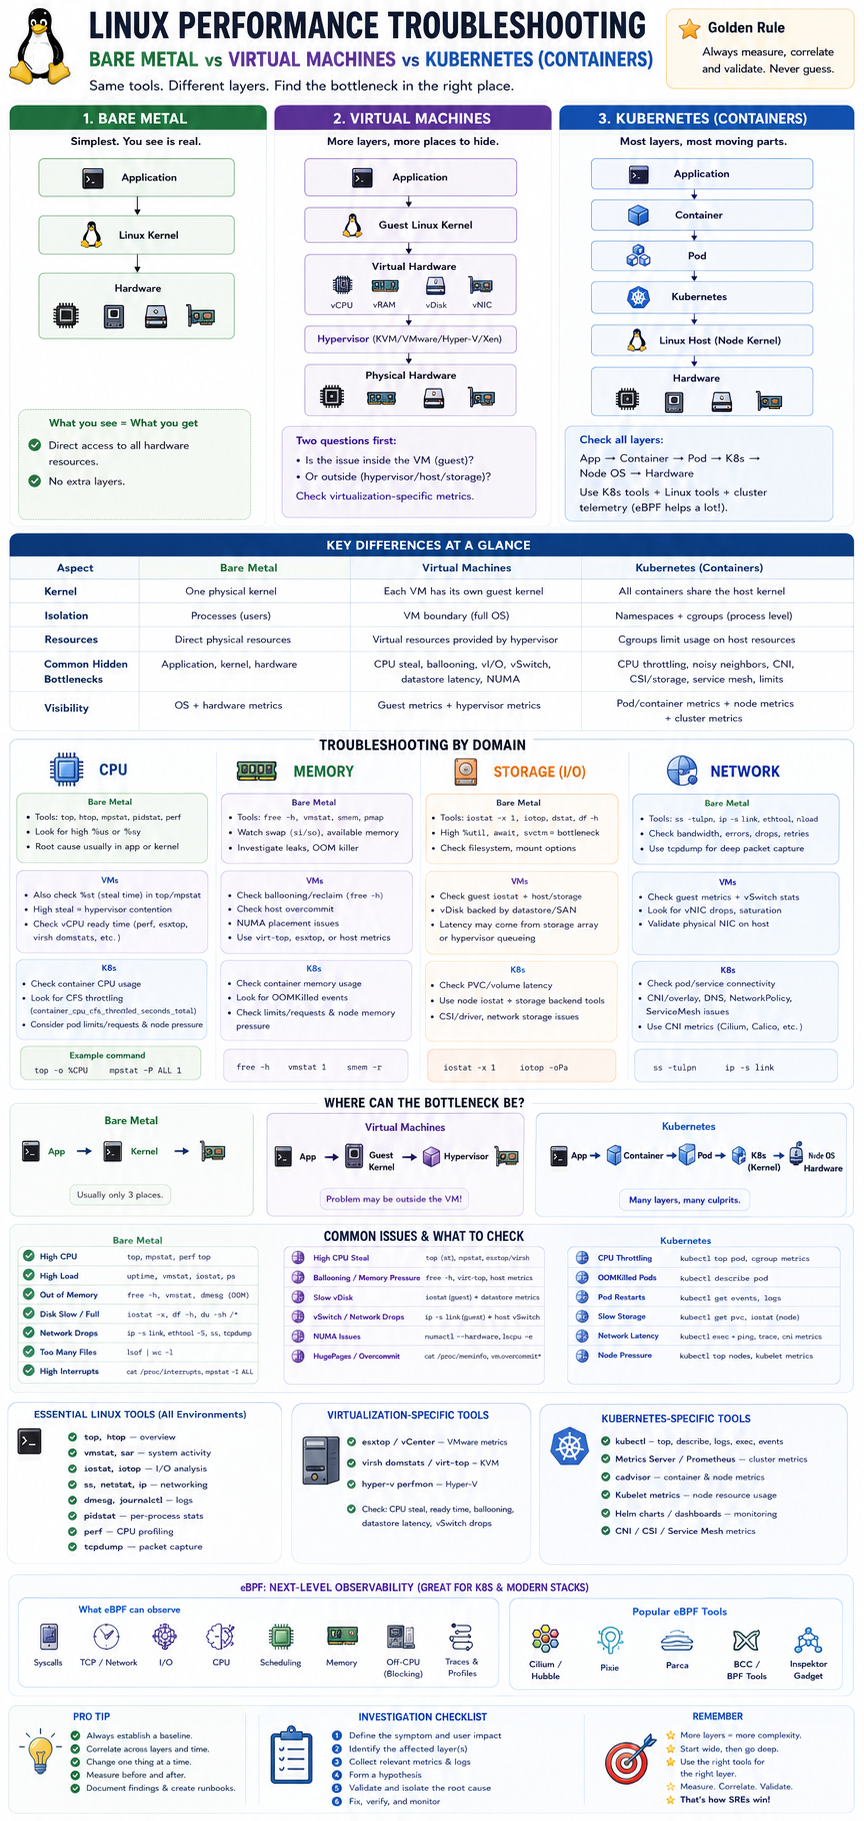
The tools are often the same, but the scope of investigation changes dramatically because the bottleneck may exist in different layers.
Think of it like this:
| Environment | Layers To Investigate |
|---|---|
| Bare Metal | Application → OS → Hardware |
| VM | Application → Guest OS → Hypervisor → Hardware |
| Kubernetes | Application → Container → Pod → K8s → Node OS → Hardware |
As you move right, more layers can introduce performance issues.
1. Bare Metal Linux Performance Troubleshooting
Architecture
Application
    ↓
Linux Kernel
    ↓
Hardware
This is the simplest environment.
CPU Issue Example
User reports:
Application is slowYou investigate:
top
mpstat
pidstat
Find:
CPU = 95%Then:
perf topreveals:
pythonconsuming CPU.
Root cause:
Application issueNo virtualization layer involved.
Memory Issue Example
free -h
vmstat 1
Shows:
Swap activity
OOM pressure
Root cause likely:
Application memory leakor
Insufficient RAMStorage Issue Example
iostat -x 1Shows:
await=150ms
util=100%
Problem:
Storage subsystemNo hypervisor involved.
Network Issue Example
ethtool
ip -s link
Shows:
RX dropsLikely:
NIC
switch
cabling
Bare Metal Key Principle
Everything you see is usually real.
CPU usage = physical CPU
Memory = physical memory
NIC = physical NIC
Disk = physical disk
2. Virtual Machine Performance Troubleshooting
Now things get trickier.
Architecture:
Application
     ↓
Guest Kernel
     ↓
Virtual Hardware
     ↓
Hypervisor
     ↓
Physical Hardware
First Rule of VM Troubleshooting
Ask:
Is the issue inside the VM or outside the VM?
This is often the entire investigation.
CPU Troubleshooting in VMs
Same command:
topShows:
CPU idleYet application is slow.
Why?
CPU Steal Time
Look at:
topor
mpstatfor:
stExample:
%st = 30%Meaning:
VM wanted CPU
Hypervisor didn't schedule it
Common Interview Question
What is CPU steal time?
Answer:
Time the guest VM was ready to run but the hypervisor scheduled another VM.
Memory Troubleshooting in VMs
VM reports:
free -h32GB RAMYet performance is poor.
Why?
Ballooning
Hypervisor may reclaim RAM.
Example:
ESXi
KVM
Hyper-V
reduce memory available to guest.
NUMA Problems
Huge issue in:
Oracle
AI
HPC
Databases
VM may span NUMA nodes.
Result:
Memory latencyincreases.
Storage Troubleshooting in VMs
Guest sees:
/dev/vdabut actually:
vDisk
 ↓
Datastore
 ↓
SAN
 ↓
Storage Array
Problem
iostatshows:
await=50msQuestion:
Guest problem?
Storage array problem?
Hypervisor problem?
Need visibility into:
VMware
KVM
Proxmox
metrics too.
Network Troubleshooting in VMs
Guest:
ip linkshows:
eth0Actually:
virtio-net
 ↓
vSwitch
 ↓
Physical NIC
Potential bottlenecks:
vSwitch
SR-IOV
Host NIC
Hypervisor
VM-Specific Metrics
Always check:
CPU Steal
Ready Time
Ballooning
NUMA
Storage Latency
vSwitch Drops
3. Kubernetes / Containers
This adds another abstraction layer.
Architecture:
Application
     ↓
Container
     ↓
Pod
     ↓
Kubernetes
     ↓
Linux Host
     ↓
Hardware
First Rule of Kubernetes Troubleshooting
Never assume the problem is inside the container.
It often isn’t.
CPU Troubleshooting in Containers
Container reports:
topCPU = 100%Question:
100% of what?cgroups
Container CPU may be limited.
Example:
resources:
  limits:
    cpu: 2
Container sees:
2 CPUsNode may have:
128 CPUsCPU Throttling
Very common.
Check:
kubectl top podand
container_cpu_cfs_throttled_seconds_totalPrometheus metric.
Memory Troubleshooting in Containers
Container OOMs.
Question:
Node OOM?
Pod OOM?
Application leak?
Check:
kubectl describe podLook for:
OOMKilledThen investigate:
kubectl top podand:
free -hon node.
Storage Troubleshooting in Kubernetes
Now storage path becomes:
Container
 ↓
Volume
 ↓
CSI
 ↓
Storage Backend
 ↓
Hardware
Potential issues:
Longhorn
Ceph
EBS
NFS
not necessarily Linux.
Example:
PostgreSQL latencymight actually be:
Ceph recoveryor
Longhorn replica rebuildNetwork Troubleshooting in Kubernetes
Biggest difference from traditional Linux.
Network path:
Pod
 ↓
veth
 ↓
CNI
 ↓
Node
 ↓
Network
Need to investigate:
Cilium
Calico
Flannel
in addition to Linux.
Example:
Service latencycould be:
DNS
Service mesh
Network policy
CNI
Overlay network
not application.
Kubernetes-Specific Tools
Traditional Linux:
top
iostat
ss
still matter.
But add:
kubectl top
kubectl describe
kubectl logs
kubectl exec
kubectl get events
eBPF Changes Everything
Modern K8s troubleshooting increasingly uses:
Cilium
Hubble
Pixie
Parca
Inspektor Gadget
Instead of:
tcpdump
strace
you can observe:
Pod latency
DNS
TCP retransmits
Syscalls
Storage IO
across the entire cluster.
AI / HPC Environment
This becomes even more complex.
Example:
PyTorch Training SlowCould be:
GPU bottleneckor:
NCCL bottleneckor:
RDMA issueor:
Storage issueor:
CPU NUMA issueA modern AI cluster investigation often spans:
Application
Container
Pod
Node
Kernel
GPU
RDMA
Storage
Network Fabric
simultaneously.
SRE Interview Cheat Sheet
| Area | Bare Metal | VM | Kubernetes |
|---|---|---|---|
| CPU | top, mpstat | + Steal Time | + CPU Throttling |
| Memory | free, vmstat | + Ballooning | + OOMKilled, Limits |
| Disk | iostat | + Datastore latency | + CSI / PV latency |
| Network | ss, tcpdump | + vSwitch | + CNI / Service Mesh |
| Kernel | Direct | Guest Kernel | Shared Host Kernel |
| Isolation | Processes | VM Boundary | Namespaces + cgroups |
| Extra Layers | None | Hypervisor | K8s + CNI + CSI |
| Modern Tools | perf | perf + Hypervisor metrics | eBPF, Hubble, Pixie |
What Senior SREs Usually Say
A strong interview answer is:
“The Linux tools are largely the same across bare metal, VMs, and Kubernetes, but the challenge is identifying which layer owns the bottleneck. On bare metal the issue is usually the application, kernel, or hardware. In VMs I also investigate hypervisor effects such as CPU steal time, ballooning, NUMA placement, and datastore latency. In Kubernetes I must additionally consider cgroups, CPU throttling, pod limits, CNI networking, CSI storage, and cluster-level scheduling. For modern AI and HPC environments I extend troubleshooting into GPUs, RDMA fabrics, NCCL collectives, and use eBPF-based observability tools such as Cilium, Hubble, Pixie, and Parca to trace behaviour across the entire stack.”
This infographic is designed to answer a modern Staff/Principal SRE interview question:
“How would you use eBPF to monitor and troubleshoot Kubernetes, especially AI/HPC workloads?”
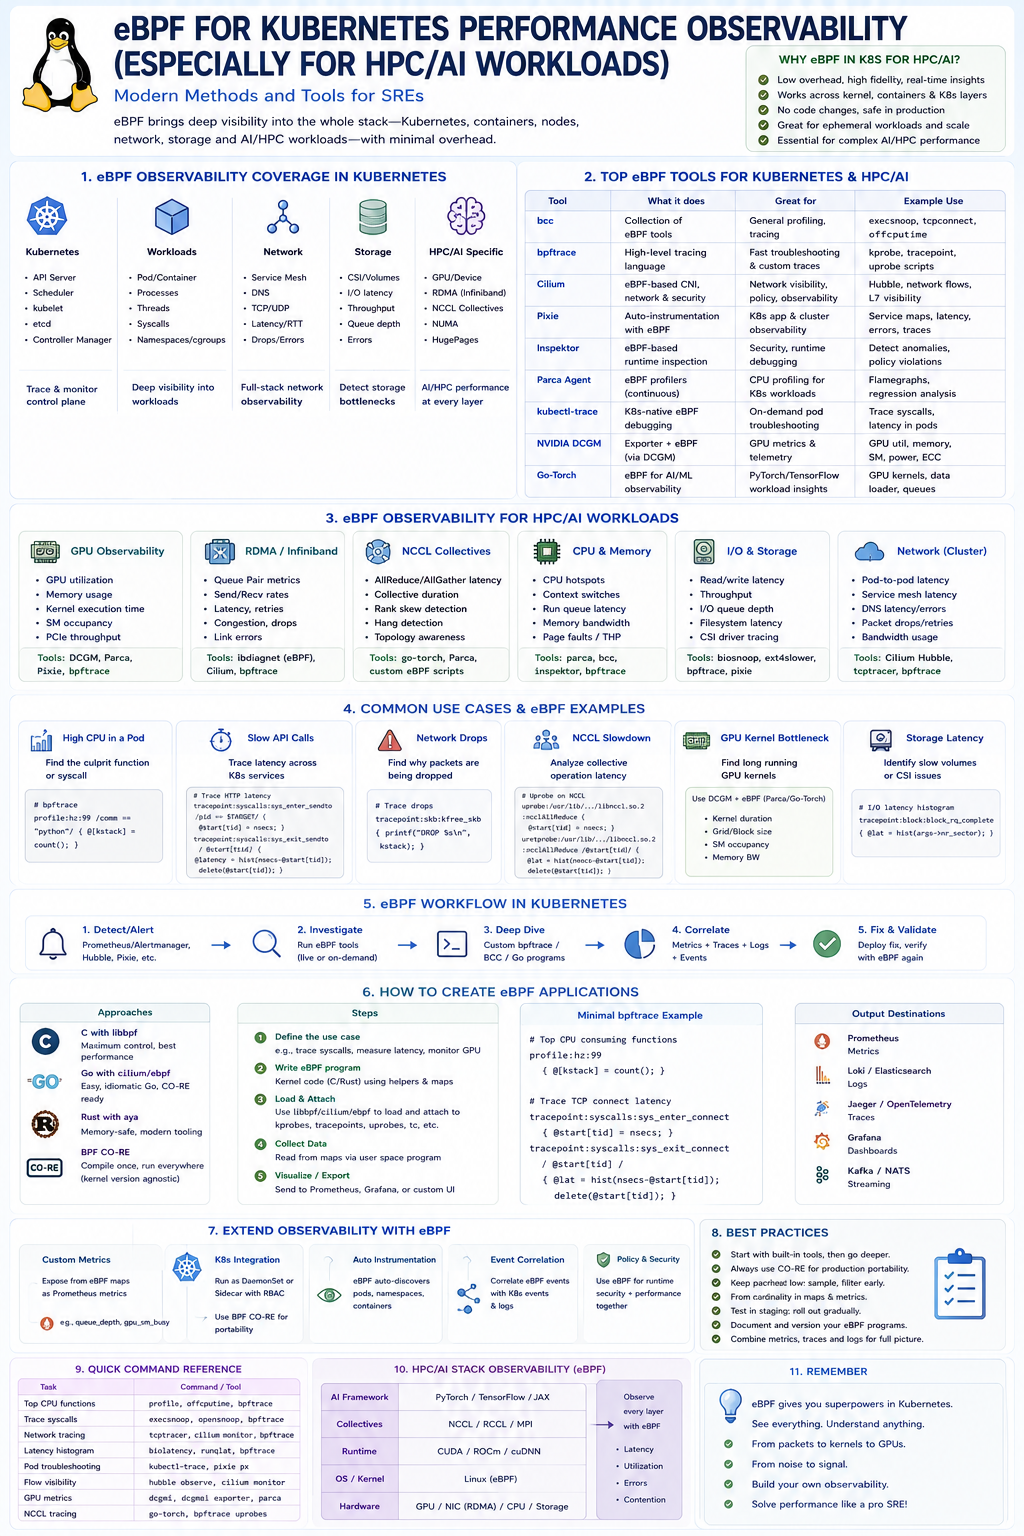
The core message is:
eBPF turns the Linux kernel into a real-time observability platform that can see everything happening in Kubernetes without modifying applications, restarting workloads, or deploying sidecars.
For AI and HPC clusters, where latency, GPUs, RDMA, NCCL, storage, and networking all interact, this is becoming one of the most important observability technologies.
What is eBPF?
eBPF (Extended Berkeley Packet Filter) allows small programs to run safely inside the Linux kernel.
Traditional monitoring:
Application
    ↓
Export metrics
    ↓
Prometheus
eBPF:
Kernel
   ↓
Observe everything directly
including:
- Syscalls
- CPU scheduling
- Memory allocation
- TCP packets
- RDMA traffic
- Storage I/O
- Container activity
- GPU interactions
without modifying applications.
Section 1: eBPF Observability Coverage
The first section explains what eBPF can see in Kubernetes.
Kubernetes Control Plane
Observe:
API Server
Scheduler
etcd
Kubelet
Controller Manager
Questions answered:
Why is scheduling slow?
Why aren't pods starting?
Why is kubelet overloaded?
Workloads
Observe:
Containers
Processes
Threads
Namespaces
Syscalls
Questions answered:
Which process is slow?
Who is consuming CPU?
What syscalls are happening?
Network
Observe:
TCP
UDP
DNS
HTTP
TLS
Questions answered:
Where is latency?
Are packets dropping?
Which service is slow?
Storage
Observe:
Filesystem latency
IO depth
CSI operations
Volume activity
Questions answered:
Why is PostgreSQL slow?
Why is storage latency high?
HPC / AI
This is where eBPF becomes especially powerful.
Observe:
GPU usage
NCCL collectives
RDMA
InfiniBand
NUMA
HugePages
Questions answered:
Why is GPU utilization low?
Why are NCCL operations stalling?
Why is RDMA slow?
Section 2: Top eBPF Tools
This section is extremely interview relevant.
BCC
Most famous toolkit.
Created by:
Meta Platforms
Contains hundreds of ready-made tools.
Examples:
execsnoop
opensnoop
tcpconnect
biolatency
Think of BCC as:
Linux troubleshooting toolkit
powered by eBPF
bpftrace
Probably the easiest eBPF tool.
Think:
awk for eBPFExample:
bpftrace -e '
tracepoint:syscalls:sys_enter_openat
{
  @[comm] = count();
}'
Answers:
Which processes are opening files?Cilium
Most important Kubernetes eBPF platform.
As you already use Cilium in your homelab:
It replaces:
iptables
kube-proxy
with:
eBPF networkingCapabilities:
Network visibility
Security
Policy enforcement
Observability
Pixie
Automatic observability.
Provides:
HTTP latency
DNS activity
Database calls
Service metrics
without instrumentation.
Parca
Continuous profiling.
Answers:
Which code paths consume CPU?without attaching debuggers.
NVIDIA DCGM
Critical for AI infrastructure.
Provides:
GPU utilisation
Memory
Power
Temperature
ECC
metrics.
Often exported into:
Prometheus
Grafana
Section 3: AI/HPC Visibility
This section explains what an AI SRE must monitor.
GPU Observability
Metrics:
GPU utilisation
Memory usage
SM occupancy
Kernel runtime
PCIe throughput
Questions:
Is the GPU busy?
Are we feeding it fast enough?
RDMA / InfiniBand
Metrics:
Queue pairs
Send rate
Receive rate
Congestion
Retries
Questions:
Is the fabric healthy?NCCL Collectives
Critical for distributed training.
Metrics:
AllReduce latency
Collective duration
Rank skew
Questions:
Why is distributed training slow?CPU and Memory
Observe:
Run queue
CPU hotspots
Context switches
NUMA locality
Page faults
Common AI issue:
GPU waiting on CPUStorage
Observe:
Read latency
Write latency
Queue depth
Filesystem latency
Questions:
Is storage starving the GPUs?Network
Observe:
Pod latency
DNS latency
Bandwidth
Retransmits
Packet loss
Questions:
Why are collective operations slow?Section 4: Real Troubleshooting Examples
These examples are extremely realistic.
High CPU Pod
Use:
profileor
perfFind:
Hot functionsSlow API Calls
Trace:
TCP latency
HTTP latency
DNS lookups
Find:
Network bottleneckPacket Drops
Use:
tcpdropor:
hubble observeFind:
Dropped packetsNCCL Slowdown
Trace:
Collective duration
Rank imbalance
Find:
One node slowing entire jobGPU Bottleneck
Observe:
Kernel execution
Memory bandwidth
SM occupancy
Find:
CPU feeding GPU too slowlyStorage Latency
Observe:
Filesystem operations
Block IO
Find:
CSI backend issueSection 5: eBPF Workflow
This is the troubleshooting methodology.
Step 1
Alert fires.
Examples:
Prometheus
Alertmanager
Grafana
Step 2
Investigate.
Run:
Pixie
Parca
bpftrace
BCC
Step 3
Create custom probes.
Observe:
Specific workloadStep 4
Correlate.
Combine:
Metrics
Logs
Traces
Events
Step 5
Fix and validate.
Verify with same probes.
Section 6: Building Your Own eBPF Applications
This is Staff-level knowledge.
Approach Choices
C + libbpf
Most powerful.
Most common in production.
Go + cilium/ebpf
Very popular.
Especially for cloud-native tools.
Examples:
Cilium
Tetragon
Inspektor Gadget
Rust
Growing rapidly.
Safer memory model.
CO-RE
Compile Once, Run Everywhere.
Major innovation.
Allows:
One eBPF binary
Many kernel versions
Development Workflow
Define Problem
Example:
Trace GPU latencyWrite Program
Attach to:
kprobe
tracepoint
uprobes
Load
Using:
bpftoolor
libbpfCollect Data
Store in:
BPF mapsExport
To:
Prometheus
Grafana
OpenTelemetry
Section 7: Extending Observability
This is where eBPF becomes transformative.
You can create metrics that never existed before.
Examples:
Custom GPU Metrics
GPU queue depth
GPU wait time
Custom Network Metrics
Per-service latencyCustom Storage Metrics
Per-volume latencySecurity Events
Process execution
File access
Privilege escalation
Section 8: Best Practices
Important interview talking points.
Start With Existing Tools
Use:
Pixie
Parca
Cilium
before writing custom code.
Use CO-RE
Improves portability.
Keep Cardinality Low
Avoid:
label explosionin Prometheus.
Version Control
Treat eBPF code as production code.
Test First
Deploy:
staging
before
production
Section 9: Command Cheat Sheet
Examples:
List loaded programs:
bpftool prog showList maps:
bpftool map showShow network programs:
bpftool netList tracing points:
bpftrace -lSection 10: HPC / AI Stack
This section explains the complete AI observability chain.
PyTorch
TensorFlow
JAX
      ↓
NCCL / MPI
      ↓
CUDA
ROCm
      ↓
Linux Kernel
      ↓
GPU
NIC
Storage
eBPF can observe activity throughout this stack.
What an Interviewer Is Looking For
A strong SRE answer would be:
“Traditional monitoring tells me that a pod is slow. eBPF tells me exactly why it is slow. In Kubernetes I can use eBPF tools such as Cilium, Hubble, Pixie, Parca, BCC and bpftrace to observe networking, storage, syscalls, CPU scheduling and application behaviour directly from the kernel. For AI and HPC workloads I extend observability into GPUs, NCCL collectives, RDMA fabrics and storage latency, allowing me to troubleshoot performance issues across the entire stack with very low overhead and without modifying applications.”
That demonstrates Linux kernel knowledge, Kubernetes expertise, observability experience, and awareness of modern AI/HPC infrastructure.