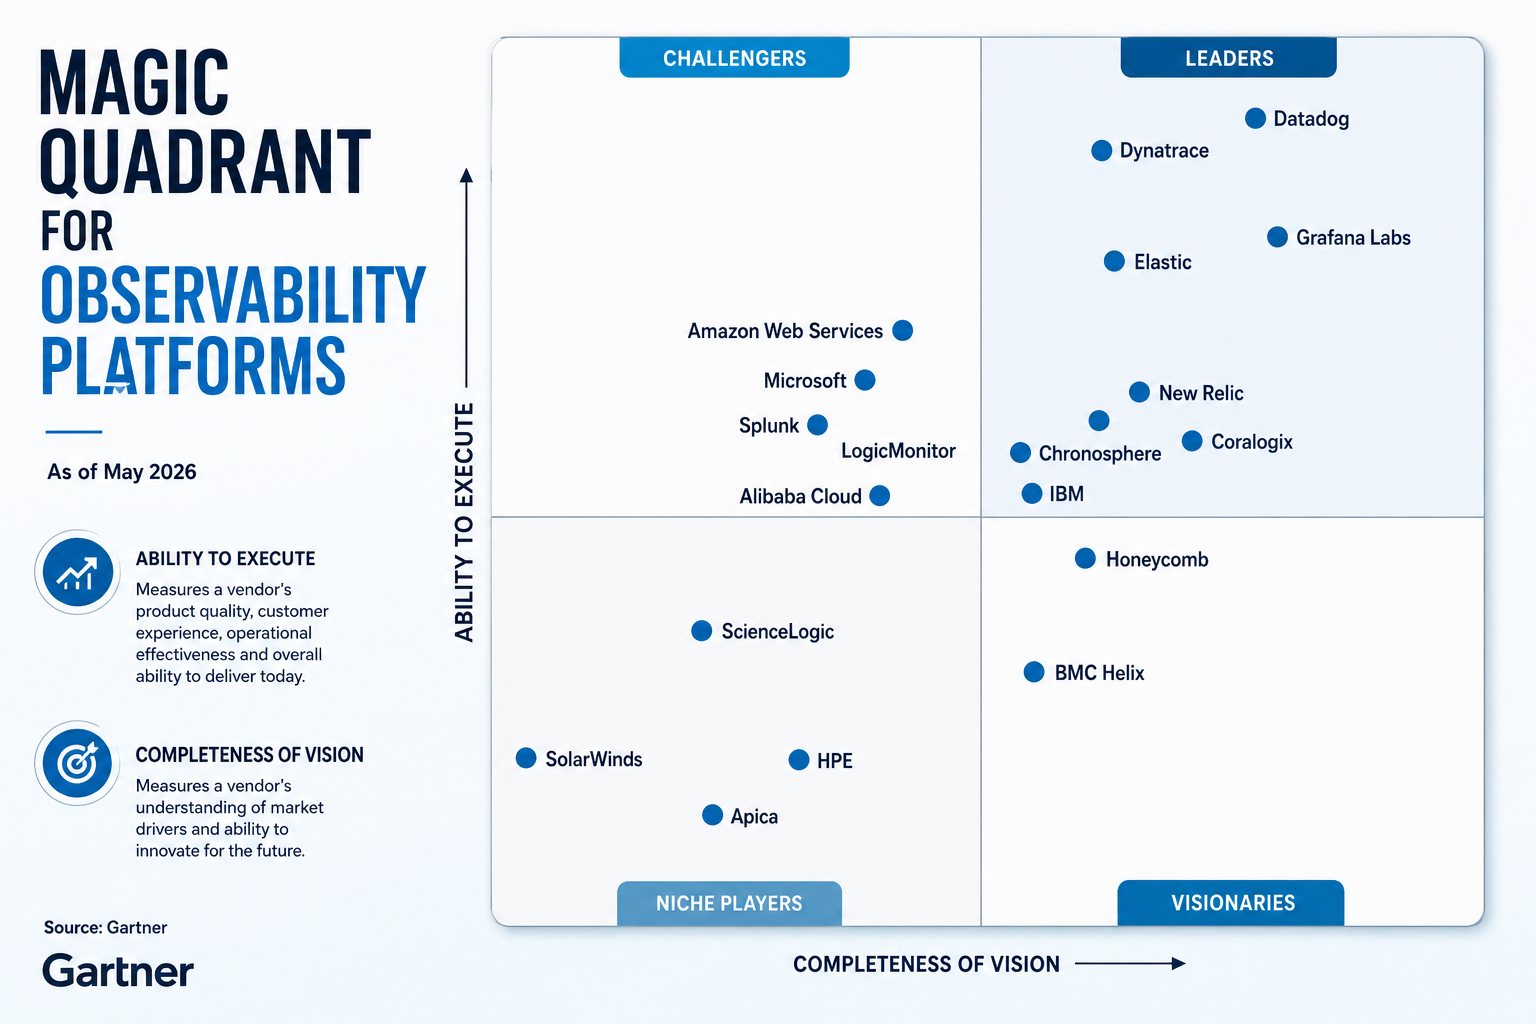
This Gartner Magic Quadrant (May 2026) shows how Gartner evaluated vendors on two axes:
- Ability to Execute (vertical): How well the company delivers today—product maturity, support, sales, customer success, scalability, ecosystem, and financial strength.
- Completeness of Vision (horizontal): How well the company is innovating for the future—cloud-native architectures, OpenTelemetry, AIOps, AI, automation, FinOps, security, and developer experience.
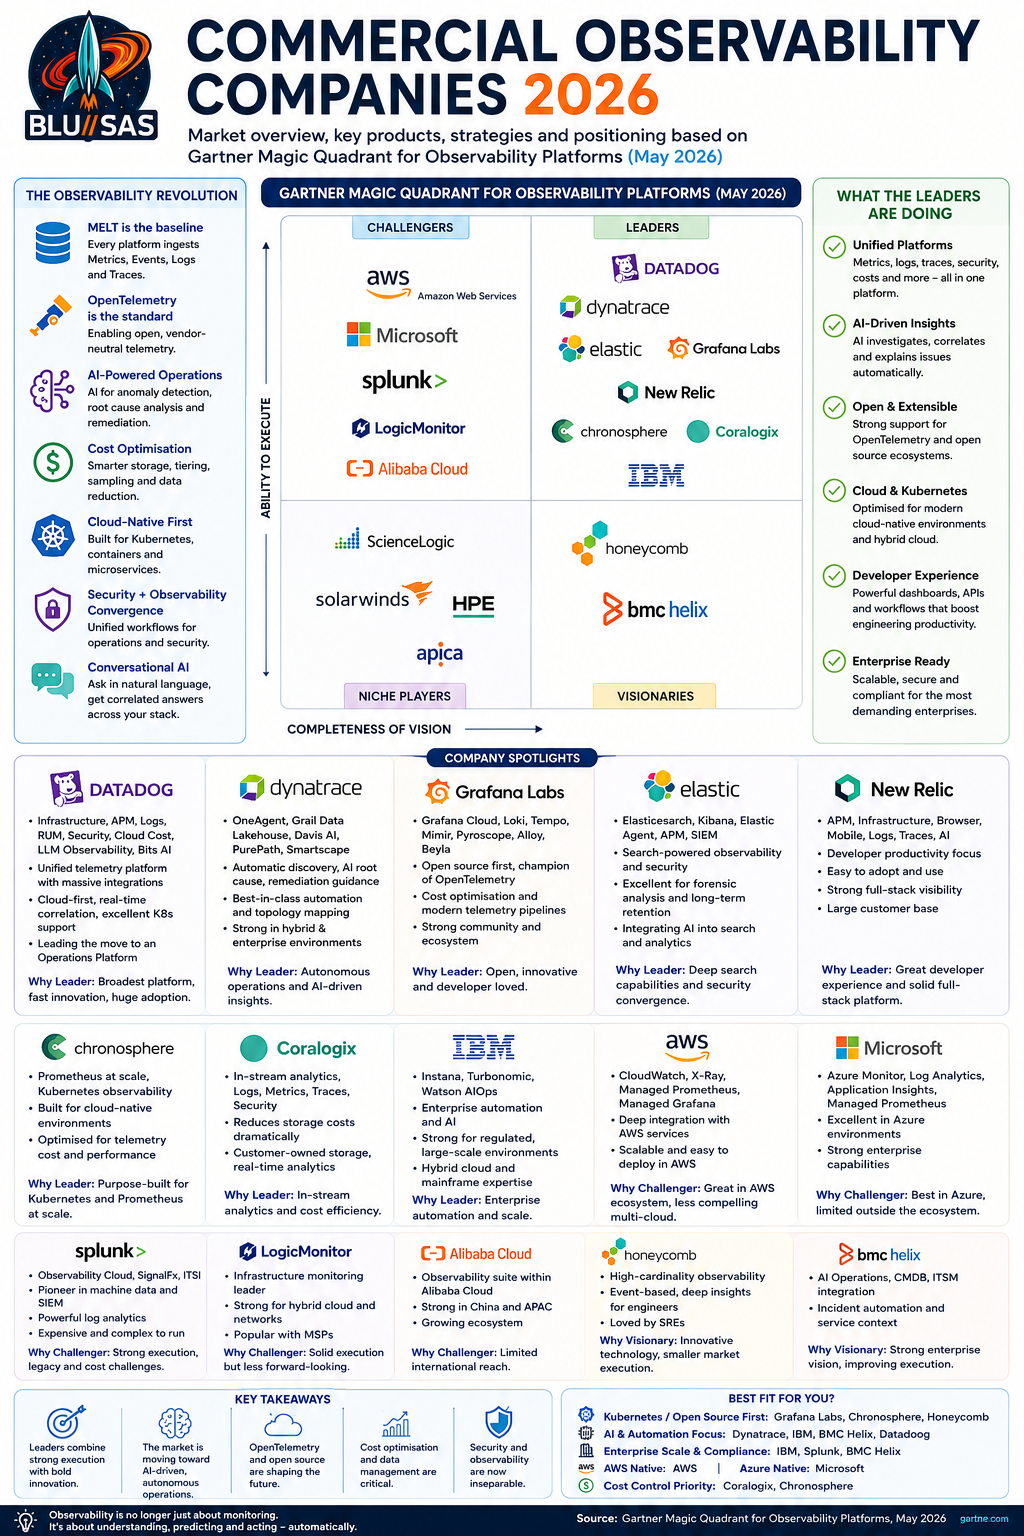
Below is what each company is doing and why it occupies its position.
🏆 Leaders
These companies combine mature products with strong innovation.
Datadog (Highest overall leader)
Primary products
- Infrastructure Monitoring
- APM
- Log Management
- RUM
- Synthetic Monitoring
- Cloud Security
- Database Monitoring
- LLM Observability
- Bits AI
Strategy
Datadog has evolved from infrastructure monitoring into a complete engineering operations platform.
It now integrates:
- Metrics
- Logs
- Traces
- Security
- Cloud cost management
- CI/CD
- Kubernetes
- AI application monitoring
Everything shares one telemetry model, allowing rapid correlation between failures.
Strengths include:
- thousands of integrations
- exceptional Kubernetes support
- cloud-first architecture
- excellent dashboards
- AI-assisted troubleshooting
Why Gartner ranks them highest:
- extremely broad functionality
- very fast innovation
- excellent enterprise execution
- huge customer adoption
Weaknesses:
- expensive at scale
- licensing complexity
Datadog’s direction is toward an Operations Platform rather than simply an observability tool.
Dynatrace
Key products
- OneAgent
- Grail Data Lakehouse
- Davis AI
- PurePath tracing
- Smartscape topology
Dynatrace focuses on automation.
Rather than showing dashboards, it attempts to answer:
“Why is this broken?”
Its AI automatically:
- discovers services
- builds dependency graphs
- performs root cause analysis
- suggests remediation
Major strengths:
- automatic instrumentation
- topology discovery
- causal AI
- enterprise automation
It excels in:
- OpenShift
- Kubernetes
- VMware
- Hybrid cloud
Dynatrace is leading the move toward Autonomous Operations, where AI investigates incidents before engineers do.
Grafana Labs
Products:
- Grafana Cloud
- Grafana Enterprise
- Loki
- Tempo
- Mimir
- Pyroscope
- Beyla
- Alloy
Grafana pioneered Open Observability.
Rather than locking customers into proprietary agents, Grafana embraces:
- Prometheus
- OpenTelemetry
- Kubernetes
- Open source
Its philosophy is:
Keep telemetry open.
Recent innovation includes:
- continuous profiling
- LGTM stack
- OpenTelemetry pipelines
- cost optimisation
This is why its vision score is extremely high.
Elastic
Originally:
Elasticsearch
Now:
- Elasticsearch
- Kibana
- Elastic Agent
- Elastic APM
- SIEM
- Security
Elastic’s differentiator is search.
Everything becomes searchable:
- logs
- traces
- metrics
- documents
- security events
Excellent for:
- forensic analysis
- long-term retention
- security correlation
Increasingly integrating AI into search and analytics.
New Relic
Originally one of the pioneers of APM.
Today offers:
- APM
- Infrastructure
- Browser Monitoring
- Mobile Monitoring
- Logs
- Traces
- AI
Strong focus:
Developer productivity.
Excellent developer workflows and relatively simple adoption make it attractive despite intense competition.
Chronosphere
Built around Kubernetes.
Focus areas:
- Prometheus at scale
- Kubernetes observability
- cloud-native optimisation
- telemetry cost reduction
Designed for organisations collecting enormous Prometheus datasets.
Excellent for modern cloud-native platforms.
Coralogix
Differentiator:
In-stream analytics
Instead of storing everything first, Coralogix analyses telemetry as it arrives.
Benefits:
- reduced storage costs
- rapid analytics
- customer-owned storage
- security integration
Very attractive for organisations struggling with exploding observability costs.
IBM
IBM combines:
- Instana
- Turbonomic
- Watson AIOps
Their vision is enterprise automation.
Very strong for:
- large regulated organisations
- mainframes
- hybrid cloud
⚔️ Challengers
Good products but slightly behind the leaders in innovation.
Amazon Web Services
Products:
- CloudWatch
- X-Ray
- Managed Prometheus
- Managed Grafana
AWS dominates AWS environments.
Strengths:
- tight AWS integration
- scalability
- simple deployment
Weakness:
Less attractive for true multi-cloud enterprises.
Microsoft
Products:
- Azure Monitor
- Log Analytics
- Application Insights
- Managed Prometheus
Excellent inside Azure.
Still less compelling outside Microsoft’s ecosystem.
Splunk
Products:
- Splunk Enterprise
- Splunk Observability Cloud
- SignalFx
- ITSI
Historically:
The king of machine data.
Still outstanding for:
- log analytics
- security
- SIEM
Challenges:
- expensive
- complex
- transitioning after Cisco acquisition
LogicMonitor
Strong at:
- infrastructure
- hybrid cloud
- networks
Very popular among MSPs.
Excellent execution but less ambitious vision than newer cloud-native vendors.
Alibaba Cloud
Strong observability within Alibaba Cloud.
Limited international adoption compared with AWS or Azure.
🔭 Visionaries
High innovation but lower execution.
Honeycomb
Perhaps the most influential technical company.
Created modern ideas including:
- high-cardinality telemetry
- event-driven observability
- distributed tracing workflows
Target audience:
Senior SRE teams.
Engineers love Honeycomb.
Business adoption is smaller than Datadog.
BMC Helix
BMC is evolving from ITSM into AI Operations.
Strong integration with:
- CMDB
- Service Management
- Incident automation
Still building execution compared with cloud-native competitors.
🎯 Niche Players
Good products but narrower focus.
ScienceLogic
Very strong for:
- infrastructure discovery
- hybrid enterprise
- MSP environments
Less focused on developer observability.
SolarWinds
Known for:
- network monitoring
- server monitoring
Moving toward observability by adding:
- logs
- APM
- machine learning
- AI
Still strongest in traditional infrastructure operations rather than cloud-native engineering.
HPE
Products:
- OpsRamp
- Aruba observability
Focus:
Enterprise infrastructure management.
Especially attractive to HPE customers.
Apica
Specialises in:
- synthetic monitoring
- load testing
- API monitoring
Excellent in that niche.
Not a complete observability platform.
Overall market direction
This Magic Quadrant highlights several major industry trends:
- MELT is now the baseline – every serious platform ingests Metrics, Events, Logs and Traces.
- OpenTelemetry has become the standard for telemetry collection, reducing dependence on proprietary agents.
- AI-assisted operations (AIOps) are becoming a core differentiator, with platforms using AI for anomaly detection, root-cause analysis, and remediation recommendations.
- Cost optimisation is increasingly important because telemetry volumes are growing rapidly; vendors are investing in smarter storage, tiering, sampling, and data reduction.
- Cloud-native and Kubernetes-first architectures are now expected, reflecting the industry’s shift toward containers and microservices.
- Security and observability are converging, with many platforms correlating operational telemetry and security signals into a unified workflow.
- Conversational AI is emerging, allowing engineers to ask natural-language questions such as “Why did checkout latency increase after today’s deployment?” and receive correlated answers generated from logs, metrics, traces, deployment events, and topology.
Given your focus on SRE, Observability Platform Engineering, OpenTelemetry, Kubernetes, Prometheus/Grafana LGTM, and AI-driven operations, the platforms most aligned with that trajectory are Grafana Labs, Dynatrace, Datadog, Chronosphere, and Honeycomb. They are setting the direction for modern observability platforms that move beyond monitoring into intelligent, automated operations.
New Magic Quandrant for Observability
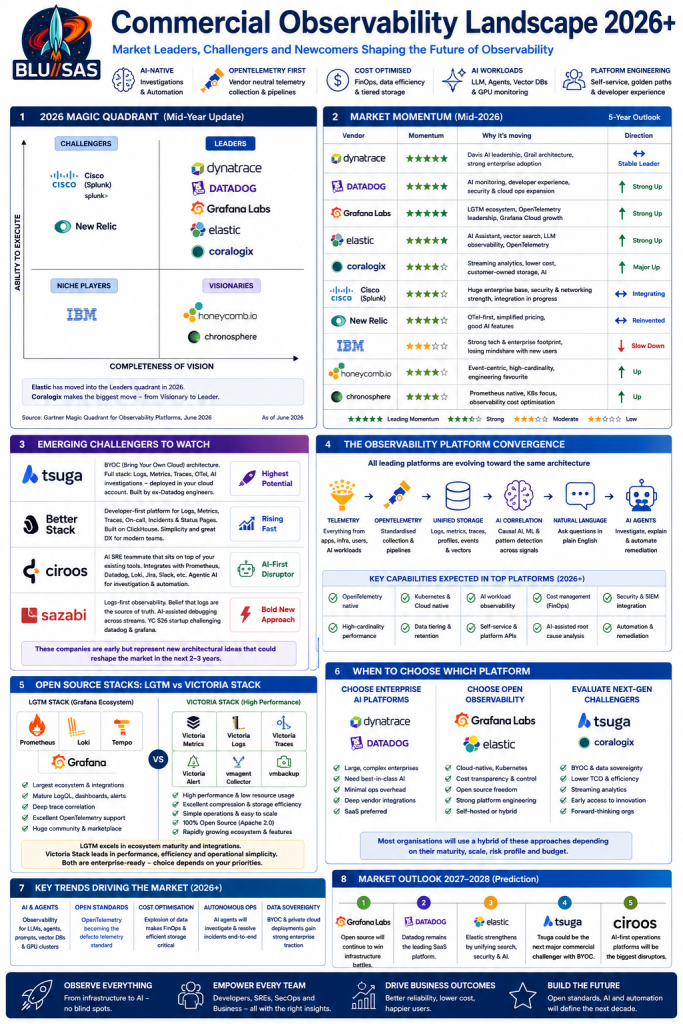
I think it’s worth doing this as a fresh assessment rather than simply reproducing Gartner. Gartner is necessarily a snapshot, whereas the market has continued to evolve rapidly through mid-2026.
Here’s how I currently see the commercial observability market.
| Vendor | Momentum (mid-2026) | Direction |
|---|---|---|
| Dynatrace | ★★★★★ | ↔ Stable leader |
| Datadog | ★★★★★ | ↑ Strong upward momentum |
| Elastic | ★★★★★ | ↑ Moving strongly upward |
| Grafana Labs | ★★★★★ | ↑ Fastest growing open ecosystem |
| Coralogix | ★★★★☆ | ↑ Major upward move |
| Cisco (Splunk) | ★★★★☆ | ↔ Integrating after acquisition |
| IBM | ★★★☆☆ | ↓ Slowly losing mindshare |
| New Relic | ★★★★☆ | ↔ Reinvented but quieter |
| Honeycomb | ★★★★☆ | ↑ Strong engineering niche |
| Chronosphere | ★★★★☆ | ↑ Cloud-native specialist |
My revised 2026 Magic Quadrant
Leaders
Dynatrace
- Still arguably the most technically complete enterprise platform.
- Davis AI remains one of the strongest causal AI engines.
- Grail architecture is maturing.
- Excellent Kubernetes, OpenTelemetry and AI workload support.
- Strong in large regulated enterprises.
Datadog
- Probably has the strongest commercial momentum.
- AI monitoring has become a major growth driver.
- Excellent developer experience.
- Continues expanding into security, AI agents and cloud operations.
- Increasingly becoming the “AWS of observability.”
Grafana Labs
- The biggest winner in open observability.
- LGTM has become the de facto open-source stack.
- OpenTelemetry alignment is exceptional.
- Grafana Cloud is gaining enterprise adoption.
- Increasingly viewed as a genuine alternative to Datadog for many organisations.
Elastic
- No longer “just ELK.”
- AI Assistant.
- Vector search.
- LLM observability.
- SIEM plus observability.
- Strong OpenTelemetry support.
- Excellent hybrid deployments.
- Has successfully repositioned itself as a full observability platform.
Upper Leaders / Rising Fast
Coralogix
This is probably the biggest story of 2026.
Five years ago almost nobody mentioned Coralogix.
Today they offer:
- streaming analytics
- lower storage costs
- customer-owned storage
- AI investigations
- OpenTelemetry
- enterprise platform
They’ve moved from Visionary to Leader and are becoming a serious alternative to Datadog and Dynatrace.
Challengers
Cisco (Splunk)
Strengths:
- huge enterprise customer base
- market-leading logging
- Cisco networking integration
- security
- SIEM
Weaknesses:
- still integrating Splunk into Cisco’s broader platform
- perceived complexity and cost
- slower cloud-native experience than newer competitors
Cisco is formidable, but the market is watching how well it turns Splunk into a unified observability and security platform.
New Relic
A few years ago New Relic looked vulnerable.
Now:
- OpenTelemetry-first
- simplified pricing
- good AI features
- strong developer experience
It feels healthier than it did in 2023–2024, although it generates less excitement than Datadog or Grafana.
Visionaries
Honeycomb
Still one of the most innovative companies.
Excellent at:
- high-cardinality telemetry
- event-first observability
- distributed tracing
- OpenTelemetry
Smaller market share, but many observability engineers admire its technical direction.
Chronosphere
Growing steadily.
Strengths:
- Kubernetes
- Prometheus
- OpenTelemetry
- cloud-native operations
- observability cost optimisation
Well positioned if enterprises increasingly prioritise reducing telemetry costs.
Niche / Declining
IBM
IBM remains technically capable, particularly when combined with Instana and Turbonomic.
However:
- less developer mindshare
- fewer cloud-native success stories
- less community momentum
Large existing IBM customers continue to see value, but greenfield adoption appears less common.
The biggest trend isn’t the vendors
The biggest change since 2024 isn’t who is in the Leaders quadrant.
It’s what the Leaders are becoming.
Every major platform is converging on the same architecture:
Telemetry
      │
OpenTelemetry
      │
Unified Storage
      │
AI Correlation
      │
Natural Language
      │
AI Agents
      │
Autonomous Remediation
The competition is no longer “who has the best dashboards.”
It’s:
- Who has the best AI?
- Who integrates best with OpenTelemetry?
- Who keeps telemetry costs under control?
- Who can observe AI systems themselves?
- Who can automate investigations and remediation?
For someone building an Observability Platform Engineering capability like the one you’ve been designing, I would currently group the market into four strategic tiers:
- Enterprise AI platforms: Dynatrace, Datadog.
- Open observability leaders: Grafana Labs, Elastic.
- Next-generation challengers: Coralogix, Chronosphere, Honeycomb.
- Established enterprise incumbents: Cisco (Splunk), IBM, New Relic.
I think this provides a more useful view of the market than simply reading the Magic Quadrant because it captures the direction of travel, not just the published positions.
If you’re updating your infographic, I would go a step further and produce a “Commercial Observability Landscape 2026+” that shows market momentum (who is accelerating and who is plateauing) alongside the traditional Magic Quadrant positioning. That would better reflect how practitioners are evaluating platforms today.
Are there any newcomers like tsuga who could challenge?
Absolutely. I think the most interesting part of the market is no longer the established vendors—it’s the new architectural ideas emerging from startups. Several companies have the potential to reshape observability over the next few years, although they’re at different stages of maturity.
1. Tsuga ★★★★★ (Most interesting newcomer)
This is the startup I’m watching most closely.
Tsuga was founded in 2024 by former Datadog engineers and is built around a Bring Your Own Cloud (BYOC) architecture. Rather than sending telemetry to a vendor-owned SaaS, the platform runs inside the customer’s own cloud account while Tsuga manages the software. That gives customers data sovereignty and avoids the infrastructure markup typical of SaaS observability platforms.
Its value proposition is:
- Logs
- Metrics
- Traces
- OpenTelemetry
- AI-assisted investigations
- Enterprise UI
- BYOC deployment
This architecture directly addresses one of the industry’s biggest pain points: observability cost.
Could it challenge Datadog?
Potentially, yes. The combination of BYOC, OpenTelemetry, and AI is compelling, but Tsuga still needs to prove it can scale its customer base and ecosystem.
2. Better Stack ★★★★★
Better Stack has quietly become one of the fastest-growing developer-focused platforms.
Its stack includes:
- Logs
- Metrics
- Traces
- Incident management
- On-call
- Status pages
It’s built on ClickHouse rather than Elasticsearch or Loki and is aimed at making observability simple for engineering teams.
This is more of a developer-first alternative than an enterprise competitor to Dynatrace.
3. Ciroos ★★★★★
This is a different category.
Ciroos isn’t trying to replace Datadog or Grafana. It’s building an AI SRE teammate that sits on top of existing observability platforms.
It integrates with systems such as:
- Prometheus
- Datadog
- Jira
- Slack
and uses agentic AI to investigate incidents and automate operational workflows.
This is very close to the “Conversational AIOps” architecture you’ve been exploring.
4. Sazabi ★★★★☆
Sazabi emerged from Y Combinator in 2026 with a different philosophy.
Rather than presenting engineers with dozens of dashboards, it argues that logs are the primary source of truth and focuses on making log streams the central operational interface for AI-assisted debugging. It recently raised seed funding and explicitly positions itself against Datadog and Grafana.
It’s still very early, but the idea is interesting.
5. Honeycomb ★★★★★
Not a newcomer, but still one of the most influential innovators.
Honeycomb popularised:
- event-based observability,
- high-cardinality telemetry,
- OpenTelemetry-first thinking.
Many ideas that later became mainstream in larger platforms originated there.
6. Chronosphere ★★★★☆
Chronosphere has become a strong cloud-native observability specialist.
Its strengths include:
- Kubernetes
- Prometheus
- OpenTelemetry
- telemetry cost optimisation
It’s growing steadily, particularly among organisations already invested in Prometheus ecosystems.
The next disruption
I think the biggest disruption won’t come from another “better dashboard.”
It will come from a different deployment model.
| Architecture | Example |
|---|---|
| SaaS | Datadog |
| Self-hosted | Grafana LGTM |
| Hybrid | Elastic |
| BYOC | Tsuga |
| AI-first | Ciroos |
The BYOC model is especially interesting because it tackles a fundamental challenge: as telemetry volumes grow, storage and data egress costs become a major concern. Running the observability data plane inside the customer’s cloud can significantly reduce those costs while keeping sensitive data under the customer’s control.
My prediction for 2027–2028
If I were placing bets today:
- Grafana Labs will continue to dominate the open-source ecosystem.
- Datadog will remain the leading SaaS platform.
- Elastic will keep strengthening its position by combining observability, security, and AI.
- Tsuga has the clearest opportunity to become the next major commercial challenger if its BYOC strategy gains broad enterprise adoption.
- Ciroos represents what I believe is the next frontier: AI that doesn’t just observe systems but actively investigates and helps resolve incidents.
For someone focused on Platform Engineering, OpenTelemetry, Kubernetes, and AI-assisted operations, I’d keep a particularly close eye on Tsuga, Ciroos, and the VictoriaMetrics ecosystem. They are approaching observability from first principles rather than simply incrementally improving existing platforms.
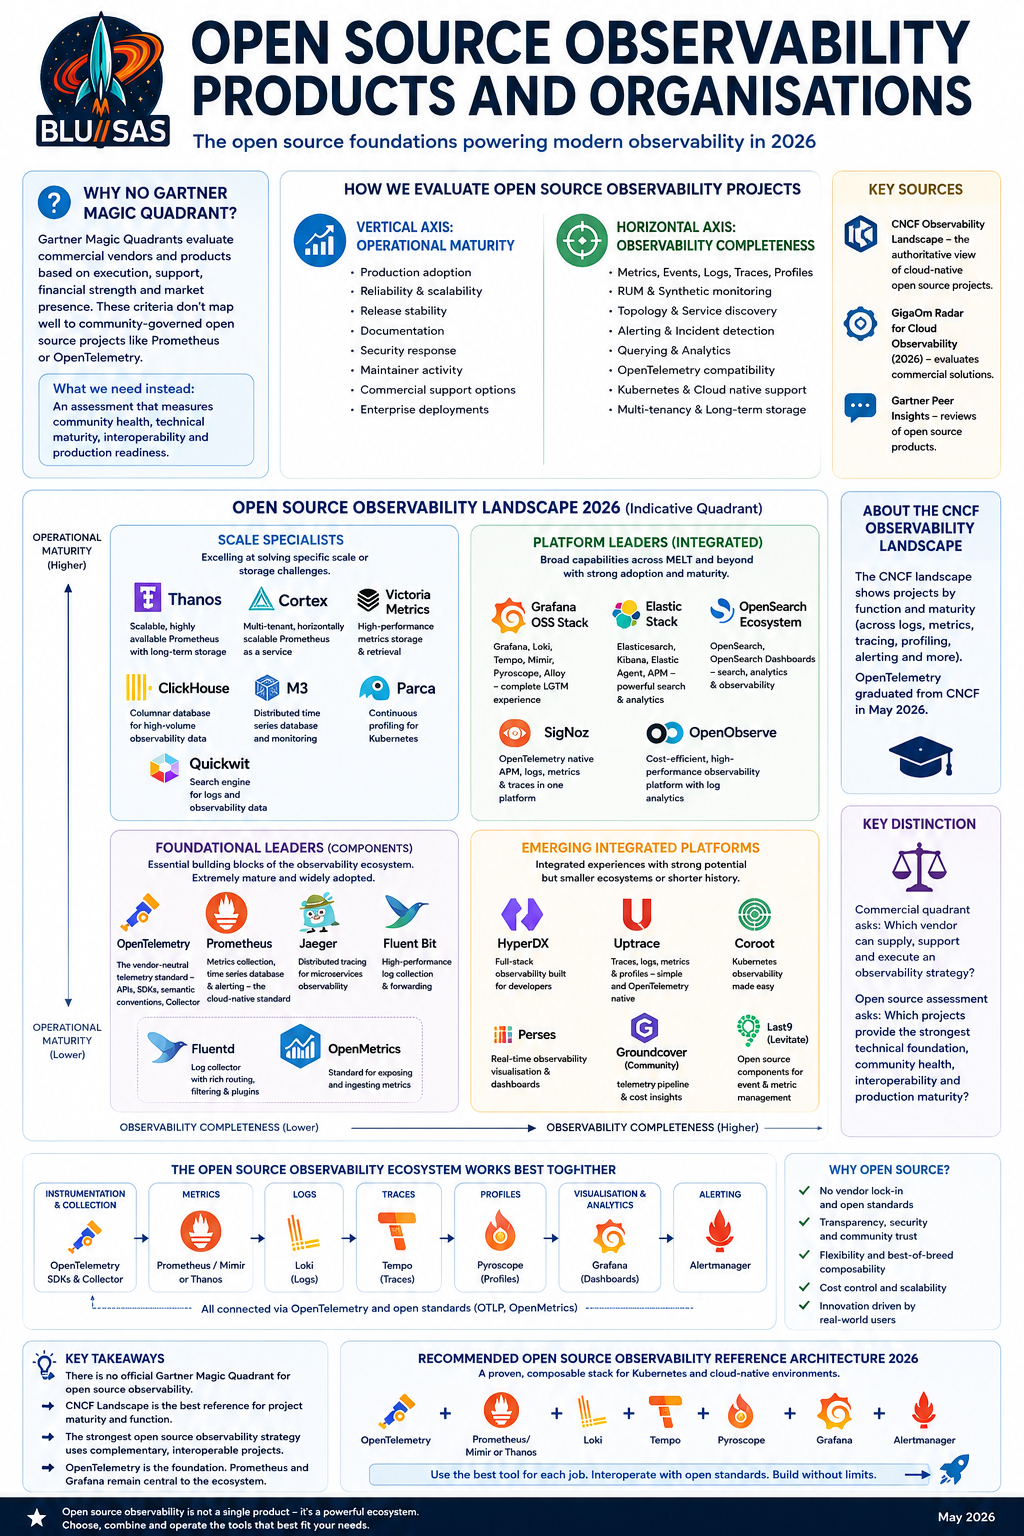
There is no Gartner Magic Quadrant dedicated specifically to open-source observability projects or foundations.
Gartner Magic Quadrants evaluate technology providers and commercially purchasable products, including their sales execution, customer support, financial viability, product strategy and market presence. Those criteria do not map cleanly onto community-governed projects such as Prometheus, OpenTelemetry or Jaeger. Gartner’s Observability Platforms quadrant therefore ranks vendors—even where their products contain substantial open-source technology.
Closest available alternatives
CNCF observability landscape
The Cloud Native Computing Foundation provides the most authoritative view of the cloud-native open-source ecosystem. It does not rank projects into Leaders, Challengers and Visionaries, but classifies them by function and maturity.
Important CNCF observability projects include:
- OpenTelemetry — instrumentation, APIs, SDKs, semantic conventions and telemetry collection
- Prometheus — metrics collection, time-series storage and alerting
- Jaeger — distributed tracing
- Fluentd and Fluent Bit — log collection and forwarding
- Thanos — scalable, highly available and long-term Prometheus storage
- Cortex — horizontally scalable multi-tenant Prometheus
- OpenMetrics — metrics exposition standard
- Perses — observability visualisation and dashboards
OpenTelemetry graduated from CNCF in May 2026, indicating that CNCF considers it mature, production-ready and widely adopted.
GigaOm Radar for Cloud Observability
The 2026 GigaOm Radar for Cloud Observability evaluates 25 commercial solutions. It is broader and more architecture-focused than Gartner, but it still primarily assesses products and vendors rather than independent open-source projects.
Open-source-led companies such as Grafana Labs, Elastic and others may appear, but the evaluation concerns their supported commercial platforms.
Gartner Peer Insights
Gartner Peer Insights includes reviews for some open-source or open-core products, including OpenObserve and Icinga. However, this is a product-review catalogue rather than a Magic Quadrant.
What an open-source observability quadrant should measure
A useful open-source equivalent should replace Gartner’s commercial axes.
Vertical axis: Operational maturity
This could measure:
- Production adoption
- Reliability and scalability
- Release stability
- Documentation
- Upgrade and migration safety
- Security response
- Maintainer activity
- Availability of commercial support
- Enterprise deployment references
Horizontal axis: Observability completeness
This could measure:
- Metrics
- Events
- Logs
- Traces
- Profiles
- Real-user monitoring
- Synthetic monitoring
- Service topology
- Alerting
- Query and analytics capability
- OpenTelemetry compatibility
- Kubernetes support
- Multi-tenancy
- Long-term storage
- AI-assisted investigation
A plausible 2026 open-source observability quadrant
This would be an independent assessment rather than an official Gartner result.
Platform leaders
These provide broad capabilities and demonstrate significant operational maturity:
- Grafana OSS stack — Grafana, Loki, Tempo, Mimir, Pyroscope and Alloy
- Elastic Stack — Elasticsearch, Kibana, Elastic Agent and APM
- OpenSearch ecosystem
- SigNoz
- OpenObserve
The Grafana stack is especially broad across metrics, logs, traces and profiles. Prometheus and Grafana remain highly complementary parts of the open observability ecosystem.
Foundational leaders
These are exceptionally mature and influential but are components rather than complete user-facing platforms:
- OpenTelemetry
- Prometheus
- Fluent Bit
- Jaeger
OpenTelemetry is becoming the vendor-neutral telemetry foundation, while Prometheus remains central to cloud-native metrics. CNCF describes the Collector, SDKs, Prometheus, Jaeger and Grafana as interoperable parts of an observability pipeline.
Scale specialists
These solve specific high-scale telemetry problems:
- Thanos
- Cortex
- VictoriaMetrics
- ClickHouse
- Quickwit
- M3
- Parca
They may outperform broader platforms in a particular telemetry domain but require additional components to form a complete observability platform.
Emerging integrated platforms
These aim to provide a more turnkey experience but have smaller ecosystems or shorter operational histories:
- HyperDX
- Uptrace
- Coroot
- Perses
- Groundcover Community Edition
- Last9 Levitate components, where applicable
The key distinction
A commercial quadrant asks:
Which vendor can supply, support and execute an enterprise observability strategy?
An open-source assessment should ask:
Which projects provide the strongest technical foundation, community health, interoperability and production maturity?
For an SRE platform based on Kubernetes and OpenTelemetry, the most defensible open-source reference architecture in 2026 would likely be:
OpenTelemetry + Prometheus/Mimir or Thanos + Loki + Tempo + Pyroscope + Grafana + Alertmanager
That is not one product. It is a composable observability platform assembled from interoperable projects. The trade-off is greater engineering responsibility for deployment, upgrades, tenancy, governance, capacity planning and reliability.
A credible infographic could therefore use four classifications: Integrated Platforms, Foundational Projects, Scale Specialists and Emerging Platforms, rather than copying Gartner’s commercial categories.