AIOps stands for Artificial Intelligence for IT Operations. It is a methodology for using machine learning, statistical analysis, automation, and now LLM-based reasoning to improve how infrastructure and application operations teams detect, investigate, explain, and resolve problems.
At its core, AIOps is trying to solve a very practical problem:
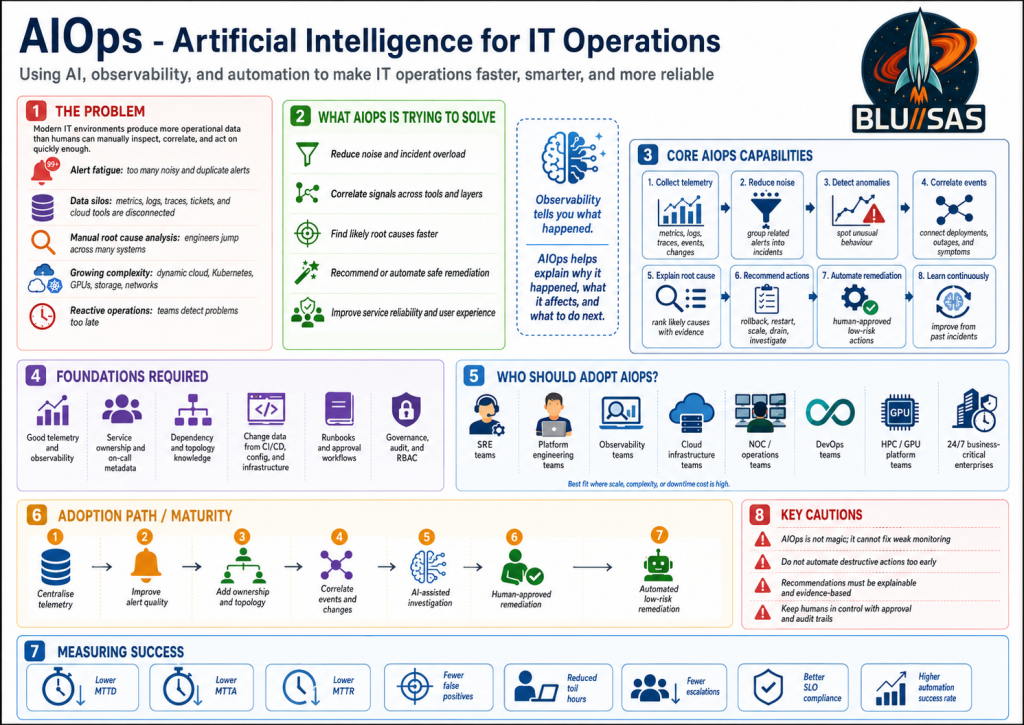
Modern systems produce more operational data than humans can manually inspect, correlate, and act on quickly enough.
That includes metrics, logs, traces, events, alerts, tickets, deployments, topology changes, CI/CD activity, cloud audit logs, Kubernetes events, OpenStack state, Slurm queues, GPU telemetry, network flows, and user-impact signals.
1. The Problem AIOps Is Trying to Solve
Modern IT operations has become too complex for purely manual troubleshooting.
A typical platform may include:
Users
  ↓
Load balancers
  ↓
Ingress / API gateways
  ↓
Kubernetes services
  ↓
Microservices
  ↓
Databases / queues / object storage
  ↓
Cloud / OpenStack / VMware / bare metal
  ↓
Networks / firewalls / DNS / storage / GPUs
Every layer emits telemetry. The problem is not lack of data. The problem is too much disconnected data.
Problem 1: Alert Fatigue
Operations teams often receive hundreds or thousands of alerts.
Many are:
- duplicates
- symptoms rather than root causes
- low priority
- transient
- missing context
- caused by the same underlying event
Example:
Disk latency high
API latency high
Pod restart count high
Database connection errors
Frontend 500s
SLO burn rate alert
User complaints
A human has to determine whether these are six separate incidents or one cascading failure.
AIOps tries to group these signals into one meaningful incident.
Problem 2: Data Silos
Metrics are in one place.
Logs are in another.
Traces are somewhere else.
Tickets are in Jira or ServiceNow.
Deployments are in GitLab or GitHub.
Infrastructure state is in OpenStack, Kubernetes, Slurm, Ceph, AWS, Azure, or VMware.
The engineer has to jump between tools:
Grafana → Loki → Tempo → Prometheus → Kubernetes → OpenStack → SSH → Jira → GitLabThat is slow, error-prone, and dependent on tribal knowledge.
AIOps tries to connect these sources and reason across them.
Problem 3: Manual Root Cause Analysis
Traditional troubleshooting is often manual correlation.
An engineer asks:
What changed?
What broke?
Who deployed?
Which node is affected?
Is this network, storage, compute, DNS, auth, GPU, database, or app?
Has this happened before?
What fixed it last time?
That investigation may take 30 minutes, 2 hours, or several days.
AIOps attempts to reduce that investigation time by automatically correlating evidence.
Problem 4: Too Much Complexity
Modern platforms are dynamic.
Examples:
- containers are rescheduled
- pods are ephemeral
- cloud instances appear and disappear
- autoscaling changes capacity
- CI/CD continuously deploys changes
- service dependencies shift
- storage volumes move
- GPU nodes are drained, allocated, or isolated
- network paths change
- certificates expire
- DNS records update
Humans are not good at mentally tracking all of that in real time.
AIOps tries to build a continuously updated operational view of the environment.
Problem 5: Reactive Operations
Traditional operations is often reactive:
Something breaks → alert fires → engineer investigates → fix appliedAIOps aims to make operations more proactive:
Early warning → anomaly detected → likely cause identified → risk predicted → action recommendedFor example:
- predict disk exhaustion
- detect memory leak patterns
- identify increasing error budgets burn
- spot noisy neighbours
- detect degraded GPU nodes
- find abnormal API latency before customers complain
- flag risky deployments
2. What AIOps Is Trying to Solve
AIOps is trying to make IT operations:
- faster
- more accurate
- less noisy
- more automated
- more predictive
- less dependent on individual experts
- better aligned with business and service impact
The goal is not simply “AI for dashboards.” The goal is to improve operational outcomes.
3. The Main Capabilities of AIOps
A mature AIOps approach usually includes several capabilities.
1. Data Collection
AIOps needs telemetry from across the environment.
Typical sources include:
Metrics       → Prometheus, Mimir, VictoriaMetrics, CloudWatch
Logs          → Loki, Elasticsearch, OpenSearch, Splunk
Traces        → Tempo, Jaeger, OpenTelemetry
Events        → Kubernetes events, OpenStack events, systemd, audit logs
Tickets       → Jira, ServiceNow, GitLab issues
Deployments   → GitLab CI/CD, GitHub Actions, ArgoCD
Infrastructure→ OpenStack, Kubernetes, Ceph, Slurm, VMware, AWS, Azure
Network       → flow logs, DNS logs, firewall logs, load balancer logs
Without good data, AIOps is weak. The first requirement is solid observability.
2. Noise Reduction
AIOps should reduce alert noise by grouping related alerts.
For example, instead of showing:
NodeDown
PodCrashLooping
HTTP5xxHigh
LatencyHigh
DatabaseConnectionFailure
SLOBurnRateHigh
it should produce something closer to:
Incident: Database node failure causing API errors

Affected services:
- checkout-api
- payment-api
- frontend

Likely root cause:
- PostgreSQL primary unavailable

Evidence:
- node db-03 stopped responding at 10:42
- API connection errors started at 10:43
- customer-facing 500s increased at 10:44
This is one of the biggest practical wins of AIOps.
3. Anomaly Detection
AIOps can learn normal behaviour and detect deviations.
Examples:
CPU usage normally peaks at 70%, now 95%
API latency usually 120 ms, now 900 ms
GPU memory errors normally zero, now increasing
Login failures normally 20/hour, now 5,000/hour
Network packet drops normally rare, now concentrated on one host
This is useful when static thresholds are poor.
A static alert might say:
CPU > 90%But anomaly detection can say:
This service normally uses 15% CPU at this time of day.
It is now using 65%, which is abnormal for this workload.
That is more context-aware.
4. Event Correlation
AIOps correlates events across systems.
Example:
10:01 - GitLab deployment completed
10:04 - Kubernetes pods restarted
10:05 - latency increased
10:06 - error rate increased
10:07 - SLO burn alert fired
The likely cause is not “latency high.” The likely cause is the deployment.
AIOps should connect those facts.
5. Root Cause Analysis
AIOps tries to identify the underlying cause, not just the symptoms.
Example:
Symptom:
Users cannot access the application.

Possible causes:
- DNS failure
- certificate expiry
- ingress failure
- pod crash
- database outage
- network ACL issue
- storage outage
- failed deployment

AIOps task:
Rank the most likely causes using evidence.
A good AIOps system does not just say:
Application is down.It says:
The application is down because the ingress controller cannot reach the backend pods.
The backend pods are healthy, but the service selector was changed in the latest deployment.
That is operationally useful.
6. Recommendation
AIOps should recommend next actions.
Example:
Recommended action:
Rollback deployment checkout-api:v2.4.1 to v2.4.0.

Reason:
Errors started within 3 minutes of the deployment.
No infrastructure errors were detected.
Previous version had normal latency and error rate.
The recommendation should include evidence, not just a guess.
7. Automation and Remediation
At higher maturity, AIOps can automate approved actions.
Examples:
Restart a failed service
Scale a deployment
Rollback a release
Drain a bad Kubernetes node
Evacuate an OpenStack compute node
Restart a failed exporter
Open a Jira ticket
Page the correct team
Run a known Ansible playbook
But automation should be controlled carefully.
The safest path is usually:
Detect → Explain → Recommend → Human approval → Execute → VerifyOnly mature, low-risk, well-tested actions should be fully automatic.
4. AIOps Compared With Traditional Observability
Traditional observability answers:
What is happening?AIOps tries to answer:
What is happening?
Why is it happening?
What changed?
What is the blast radius?
What should we do next?
Can we fix it automatically?
Observability provides the evidence.
AIOps provides correlation, reasoning, prioritisation, and action.
They are not competitors. AIOps depends on observability.
5. AIOps in Your MCP Example
In the previous MCP example, the user asks:
Why did gpu-test-01 fail to start?A traditional engineer might manually check:
openstack server show gpu-test-01
openstack console log show gpu-test-01
openstack port list
openstack hypervisor list
docker logs nova_scheduler
docker logs nova_compute
journalctl on compute nodes
sinfo
nvidia-smi
kubectl get pods
Grafana dashboards
Loki logs
Prometheus GPU metrics
An MCP-enabled AIOps agent could do much of this automatically.
It could query:
OpenStack MCP   → VM state, scheduler errors, Neutron ports
Nova MCP        → compute scheduling failure
Neutron MCP     → network binding or DHCP issue
Slurm MCP       → GPU node allocation or drain state
Prometheus MCP  → CPU, RAM, disk, GPU health
Loki MCP        → Nova, libvirt, Neutron logs
Kubernetes MCP  → GPU Operator / NVIDIA plugin status
Ceph MCP        → storage availability
Ansible MCP     → known remediation playbooks
Then return something useful:
gpu-test-01 failed because Nova could not schedule the requested PCI device.
The requested alias nvidia-gpu-audio is not defined in nova.conf.
The VM requested a GPU-related PCI alias that the scheduler cannot match.

Evidence:
- Nova API returned PCI alias nvidia-gpu-audio is not defined
- No matching pci_alias exists on the compute configuration
- Hypervisor is otherwise healthy
- Neutron port exists
- Image and flavor are valid

Recommended fix:
Add or remove the correct PCI alias definition, reconfigure Nova, restart nova-scheduler and nova-compute, then retry the server create command.
That is AIOps because the system has moved beyond raw monitoring and into assisted diagnosis.
6. The AIOps Methodology
AIOps is not just a product. It is a way of operating.
A practical methodology looks like this:
1. Instrument everything
2. Centralise telemetry
3. Normalise and enrich the data
4. Correlate events across systems
5. Detect anomalies
6. Identify service impact
7. Recommend actions
8. Automate safe remediation
9. Verify outcomes
10. Learn from incidents
The goal is continuous operational learning.
Every incident should improve the system.
7. The Maturity Model
AIOps adoption usually happens in stages.
Level 1 — Better Visibility
You collect metrics, logs, traces, and events.
Typical tools:
Prometheus
Grafana
Loki
Tempo
OpenTelemetry
Elasticsearch
Alertmanager
At this level, humans still do most of the reasoning.
Level 2 — Alert Correlation
You start grouping alerts into incidents.
Example:
20 alerts → 1 incidentThis reduces noise and improves response time.
Level 3 — Assisted Investigation
The system helps engineers investigate.
It can answer:
What changed?
What services are affected?
Are there similar previous incidents?
Which logs matter?
Which deployment caused this?
This is where LLMs and MCP become very useful.
Level 4 — Recommendation
The system recommends fixes.
Example:
Rollback service X
Restart exporter Y
Scale deployment Z
Drain node A
Check Ceph OSD B
Renew certificate C
Humans still approve the action.
Level 5 — Automated Remediation
The system performs low-risk actions automatically.
Example:
Restart crashed exporter
Re-run failed health check
Scale stateless service
Create incident ticket
Attach logs and traces
Notify owning team
High-risk actions still require approval.
8. Who Should Adopt AIOps?
AIOps is most valuable for teams running complex, distributed, high-volume, or business-critical systems.
1. SRE Teams
SRE teams are one of the best fits.
They already care about:
SLIs
SLOs
error budgets
incident response
toil reduction
automation
reliability engineering
AIOps helps SREs reduce repetitive investigation and focus on higher-value engineering.
2. Platform Engineering Teams
Platform teams should adopt AIOps when they operate shared platforms such as:
Kubernetes
OpenStack
VMware
Ceph
GitLab
ArgoCD
CI/CD platforms
internal developer platforms
AIOps helps them understand platform-wide impact and detect shared infrastructure failures.
3. Observability Teams
Observability engineers are central to AIOps.
They provide the telemetry foundation:
metrics
logs
traces
events
dashboards
alerts
instrumentation standards
OpenTelemetry pipelines
Without observability engineering, AIOps becomes guesswork.
4. NOC Teams
Network Operations Centres can use AIOps to reduce noise and improve triage.
Common use cases:
deduplicating network alerts
identifying link degradation
correlating firewall, DNS, BGP, and load balancer events
detecting regional outages
routing incidents to the right team
5. Cloud Infrastructure Teams
Teams running cloud platforms benefit heavily.
Examples:
OpenStack private cloud
AWS landing zones
Azure platforms
GCP platforms
hybrid cloud
multi-cloud
AIOps can correlate compute, network, storage, identity, quota, and deployment issues.
6. HPC and GPU Platform Teams
This is especially relevant for AI infrastructure.
A GPU/HPC platform has many failure domains:
GPU health
PCI passthrough
NVIDIA drivers
CUDA versions
Slurm queues
Kubernetes GPU Operator
RDMA / RoCE
InfiniBand
Ceph / Lustre / WEKA / DDN
container runtimes
job scheduling
tenant quotas
power and thermal limits
AIOps can help detect degraded GPU nodes, scheduling bottlenecks, failed jobs, and noisy tenants.
7. DevOps Teams
DevOps teams can use AIOps to connect deployment activity to runtime impact.
Example:
Deployment happened → error rate increased → SLO burn increased → rollback recommendedThis is especially valuable in CI/CD-heavy environments.
8. Enterprises With 24/7 Services
Any organisation with critical always-on services should consider AIOps.
Examples:
financial services
telecoms
cloud providers
SaaS companies
healthcare platforms
universities
government services
e-commerce
AI infrastructure providers
The more expensive downtime is, the more valuable AIOps becomes.
9. Who Does Not Need Heavy AIOps Yet?
AIOps may be overkill for very small or simple environments.
For example:
one small website
one database
low traffic
few alerts
manual operations are still manageable
no 24/7 support requirement
These teams should first focus on:
basic monitoring
good backups
clear alerts
simple runbooks
patching
logging
uptime checks
AIOps should not be used to compensate for weak fundamentals.
10. What AIOps Requires Before It Works Well
AIOps needs a strong foundation.
Good Telemetry
You need reliable metrics, logs, traces, and events.
Bad data produces bad recommendations.
Good Service Ownership
The system must know:
who owns the service
who is on call
what the service depends on
what its SLO is
where the runbook is
Without ownership metadata, routing and remediation are weak.
Good Topology
AIOps needs to understand relationships.
Example:
frontend depends on checkout-api
checkout-api depends on postgres
postgres runs on node db-03
db-03 uses ceph-volume-17
ceph-volume-17 depends on osd-4
osd-4 runs on storage-node-2
Topology allows the system to understand blast radius.
Good Change Data
Most incidents are caused by change.
AIOps should ingest:
deployments
config changes
Terraform changes
Ansible runs
package upgrades
Kubernetes rollouts
OpenStack reconfigures
firewall changes
DNS changes
certificate renewals
Without change data, root cause analysis is incomplete.
Good Runbooks
AIOps automation depends on safe, tested actions.
Examples:
restart service
rollback deployment
clear failed job
rotate certificate
drain node
restart exporter
scale deployment
fail over service
If the runbooks are poor, automation becomes dangerous.
11. Risks and Anti-Patterns
AIOps can fail if implemented badly.
Risk 1: Treating AIOps as Magic
AIOps is not magic.
It cannot fix poor monitoring, poor architecture, missing logs, or unclear ownership.
Risk 2: Automating Too Soon
Do not let AI perform destructive actions before trust is established.
Dangerous actions include:
delete data
restart databases
modify firewall rules
change identity policies
drain production clusters
detach storage
scale expensive GPU workloads
Start with read-only analysis, then human-approved remediation.
Risk 3: Poor Explainability
AIOps must explain why it thinks something is wrong.
Bad:
Root cause: database.Good:
Root cause is likely PostgreSQL primary saturation.
Evidence:
- connections reached max at 10:42
- API errors began at 10:43
- no deployment occurred
- CPU and disk IO increased on db-01
- similar incident occurred last month
Operations teams need evidence, not vague AI output.
Risk 4: No Human Governance
AIOps should respect operational controls:
approval workflows
audit logs
change windows
RBAC
break-glass access
compliance boundaries
incident commander authority
The AI should support operations, not bypass them.
12. What Success Looks Like
A successful AIOps implementation should improve measurable outcomes.
You should track:
MTTA  - mean time to acknowledge
MTTR  - mean time to resolve
MTTD  - mean time to detect
alert volume
false positive rate
incident recurrence
toil hours
escalation rate
SLO compliance
change failure rate
automation success rate
The goal is not “we added AI.”
The goal is:
fewer noisy alerts
faster diagnosis
better root cause analysis
lower toil
higher service reliability
safer automation
more consistent operations
13. Practical Adoption Path
A good adoption path would be:
Phase 1: Centralise telemetry
Phase 2: Improve alert quality
Phase 3: Add service ownership and topology
Phase 4: Correlate events and changes
Phase 5: Introduce AI-assisted investigation
Phase 6: Add recommendation workflows
Phase 7: Automate low-risk remediation
Phase 8: Continuously review incidents and improve models/runbooks
For your kind of environment, the most natural starting point would be:
Prometheus/Mimir + Loki + Tempo + OpenTelemetry
        ↓
Service and infrastructure inventory
        ↓
Alert correlation
        ↓
LLM/MCP assistant for investigation
        ↓
Human-approved Ansible remediation
        ↓
Closed-loop AIOps
Bottom Line
AIOps is a methodology for making operations smarter by combining:
observability
event correlation
machine learning
LLM reasoning
automation
service ownership
incident management
runbooks
governance
It is trying to solve the operational overload caused by modern distributed systems.
The teams that should adopt it first are:
SRE teams
platform engineering teams
observability teams
cloud infrastructure teams
NOC teams
DevOps teams
HPC/GPU platform teams
enterprises running critical 24/7 services
The best way to think about it is:
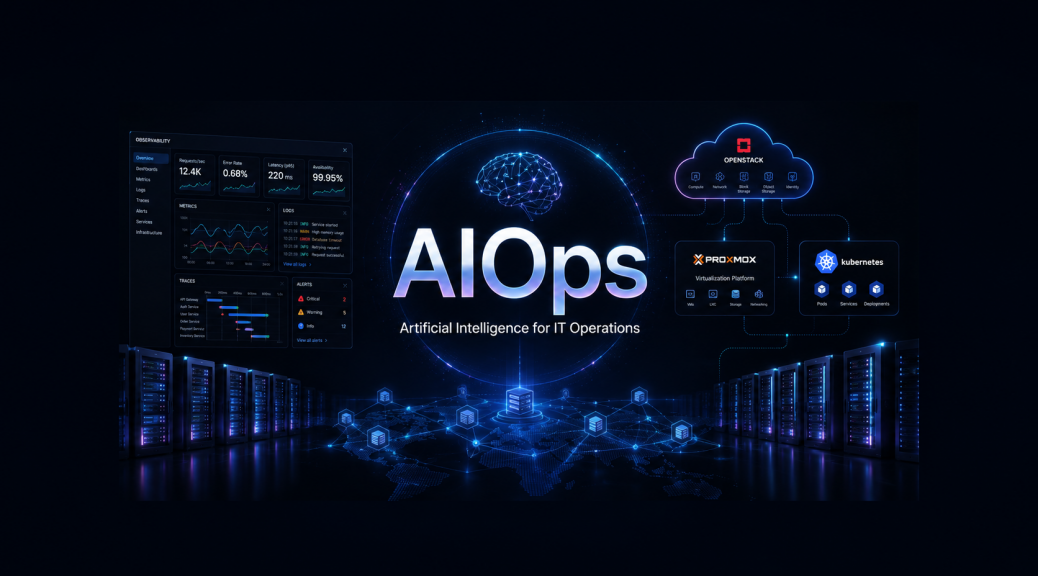
Observability tells you what happened.
AIOps helps explain why it happened, what it affects, and what to do next.
Observability Advances for Effective AIOps
Observability is arguably the most important technical component of AIOps.
AIOps is only as good as the operational data it can reason over. The AI layer does not magically understand your systems; it needs evidence. That evidence comes mainly from observability.
You can think of AIOps like this:
AIOps = AI reasoning + Observability data + Automation + ITSM/process + GovernanceOr more practically:
Observability provides the evidence.
AI performs correlation and reasoning.
Automation executes safe actions.
ITSM/process manages incidents and ownership.
Governance keeps it controlled and auditable.
Why observability is central
Observability gives the AIOps system the raw material it needs:
Metrics  → What is slow, saturated, failing, or abnormal?
Logs     → What actually happened inside the system?
Traces   → Where did the request slow down or fail?
Events   → What changed in the platform?
Alerts   → What conditions crossed operational thresholds?
Topology → What depends on what?
Without this, AI has no reliable basis for diagnosis.
For example, if an AI agent is asked:
Why did gpu-test-01 fail to start?It needs observability and operational signals from:
OpenStack state
Nova scheduler logs
Neutron events
Libvirt errors
Prometheus metrics
Loki logs
Slurm node state
GPU telemetry
Kubernetes events
Ceph health
Recent Ansible or config changes
The AI then correlates those signals into a root-cause explanation.
The hierarchy of AIOps components
I would rank the major components like this:
1. AI / ML reasoning layer
This includes:
anomaly detection
event correlation
root cause analysis
prediction
recommendation
LLM-based investigation
This is the “intelligence” part.
2. Observability and telemetry
This is the evidence layer:
metrics
logs
traces
events
alerts
service health
infrastructure state
change data
This is probably the most important foundation.
3. Topology and context
AIOps needs to know relationships:
service A depends on service B
pod runs on node X
node X uses storage volume Y
volume Y depends on Ceph OSD Z
tenant workload uses GPU node N
Without topology, the AI may see symptoms but struggle to understand blast radius.
4. Automation and remediation
This turns insight into action:
restart service
rollback deployment
scale workload
drain node
run Ansible playbook
open incident ticket
notify owning team
This is where AIOps becomes operationally powerful.
5. ITSM / incident workflow
This includes:
Jira
ServiceNow
PagerDuty
Opsgenie
Slack
Teams
runbooks
postmortems
ownership metadata
This connects AIOps to how humans actually operate.
6. Governance and security
Especially important if the system can take action:
RBAC
approval gates
audit logs
change windows
human approval
secrets control
tool permissions
So the answer is: yes, but with nuance
Yes — observability is the major foundation after AI.
But in a mature AIOps system, observability alone is not enough. You also need:
good topology
good ownership data
good change tracking
good runbooks
safe automation
clear governance
The best way to phrase it is:
AI is the reasoning engine of AIOps.
Observability is the evidence layer.
Automation is the action layer.
ITSM and governance are the control layer.
For your homelab and OpenStack/GPU/Slurm/Kubernetes direction, the key AIOps foundation would be:
Prometheus/Mimir  → metrics
Loki              → logs
Tempo             → traces
OpenTelemetry     → instrumentation
Alertmanager      → alert routing
Grafana           → visualisation
MCP               → AI tool access
Ansible           → controlled remediation
GitLab            → change/deployment context
Describe the advances in Observability to make AIOps effectiveThought for 34s
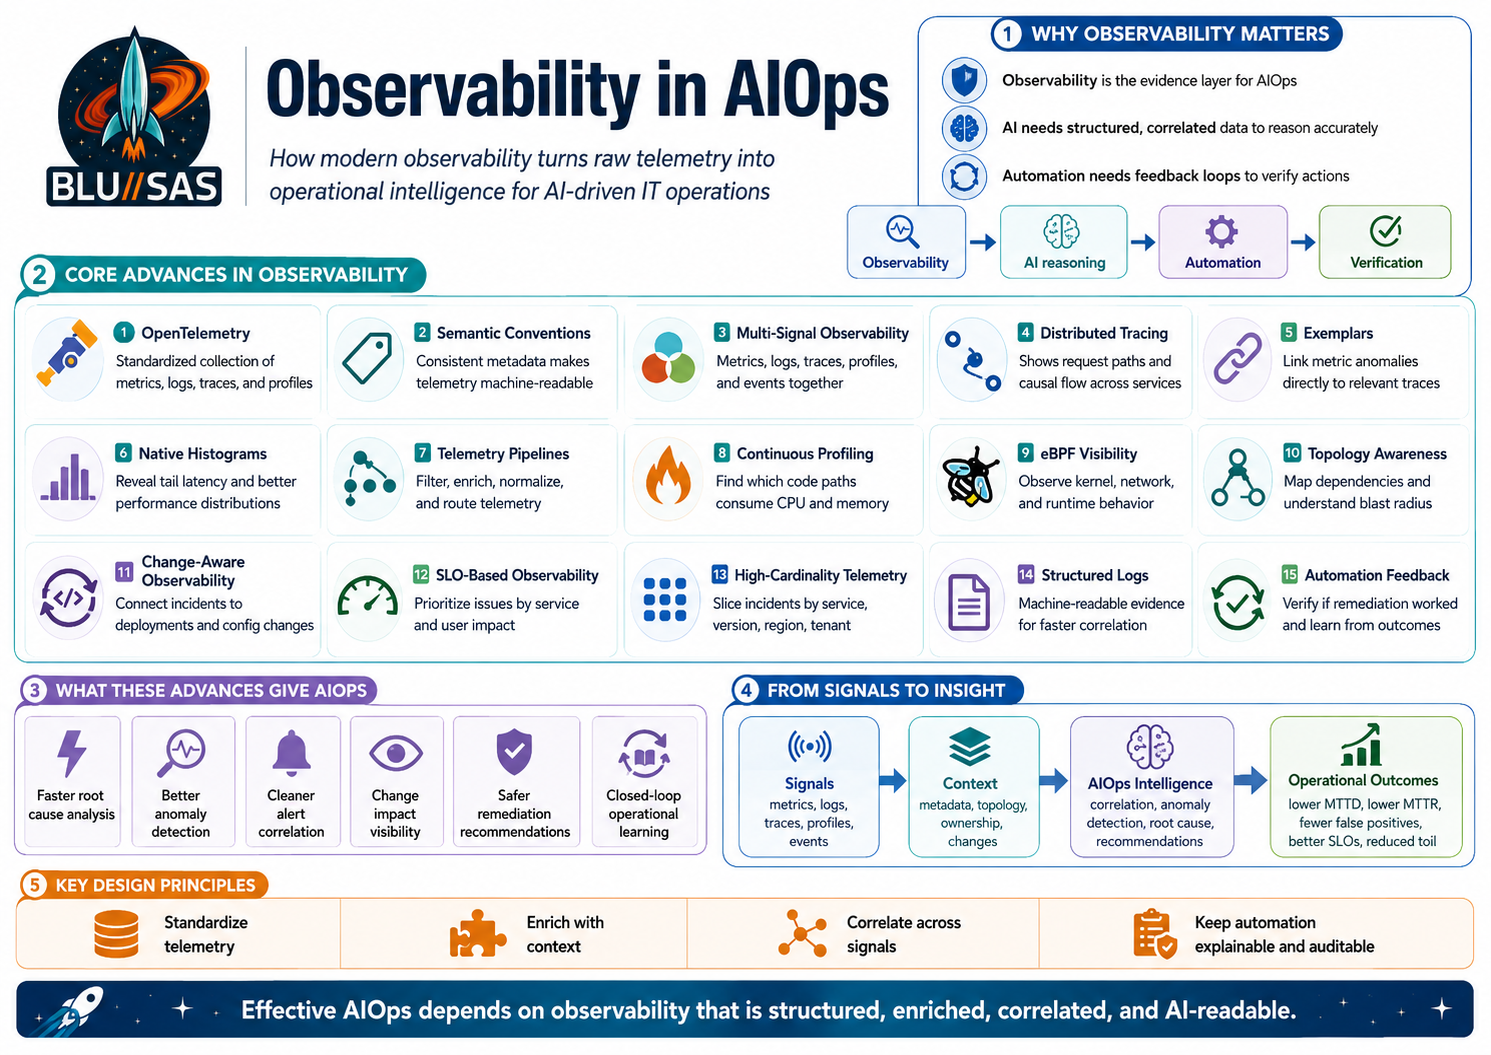
Yes. The big advances in observability that make AIOps genuinely effective are not just “more dashboards.” They are about turning raw telemetry into structured, correlated, machine-readable operational evidence that AI can reason over.
The shift is:
Old monitoring:
Thresholds, dashboards, isolated alerts, manual diagnosis.

Modern observability for AIOps:
Correlated metrics, logs, traces, profiles, events, topology, ownership,
change history, and automation context.
AIOps needs observability to answer five operational questions:
What is happening?
Where is it happening?
Why is it happening?
What changed?
What should we do next?
1. Standardised Telemetry: OpenTelemetry
One of the biggest advances is OpenTelemetry.
Historically, every observability vendor or tool had its own agent, SDK, format, and metadata conventions. That made AIOps hard because the AI had to reason across inconsistent data.
OpenTelemetry helps by giving teams a vendor-neutral way to instrument, generate, collect, and export telemetry such as traces, metrics, and logs. Its Collector provides a common way to receive, process, and export telemetry, reducing the need to run many different agents.
For AIOps, this matters because AI performs better when telemetry has consistent structure.
Example:
Bad:
"error happened on server"

Better:
service.name=checkout-api
deployment.environment=production
k8s.namespace.name=payments
host.name=worker-03
http.response.status_code=500
trace_id=abc123
That structure allows an AI system to correlate across services, clusters, nodes, requests, and deployments.
2. Semantic Conventions
Raw telemetry is not enough. The metadata needs consistent meaning.
OpenTelemetry Semantic Conventions define common names and attributes for operations and data across traces, metrics, logs, profiles, and resources.
This is crucial for AIOps because AI needs to compare like with like.
Without semantic conventions, one team may emit:
app = checkoutanother may emit:
service = checkout-apiand another:
component = payments-checkoutAn AIOps system then has to guess whether these are the same thing.
With standard conventions, the data becomes more machine-readable:
service.name = checkout-api
service.namespace = payments
deployment.environment = production
k8s.cluster.name = prod-eu-1
That makes correlation, incident grouping, ownership mapping, and root-cause analysis much stronger.
3. Multi-Signal Observability
Traditional monitoring was heavily metrics-focused.
Modern observability combines multiple signals:
Metrics  → What is happening numerically?
Logs     → What discrete events occurred?
Traces   → How did a request move through the system?
Profiles → Which code consumed CPU, memory, or wall time?
Events   → What changed in the platform?
Kubernetes documentation still describes observability around metrics, logs, and traces as the main pillars for understanding cluster state, performance, and health. OpenTelemetry also describes observability signals as system outputs that describe application and platform activity.
For AIOps, this is fundamental.
A metric may say:
API latency is high.A trace may say:
The latency is in the database query span.A log may say:
Connection pool exhausted.A deployment event may say:
New version deployed 5 minutes before the issue.A profile may say:
CPU is being consumed by JSON serialisation in one function.The AI can then produce a much better diagnosis than any single signal could provide.
4. Distributed Tracing and Context Propagation
Distributed tracing is one of the most important advances for AIOps.
In a monolith, a request might fail inside one process. In a microservices or cloud-native system, a single user request may cross:
Frontend
API gateway
Auth service
Checkout service
Payment service
Inventory service
Database
Message queue
External SaaS API
A trace connects those hops into one request journey.
For AIOps, tracing gives causal structure. It helps answer:
Where did the request slow down?
Which service returned the error?
Was the failure upstream or downstream?
Which tenant, region, node, or deployment was involved?
This makes root-cause analysis much more precise.
Without tracing, AIOps sees a pile of logs and metrics.
With tracing, it sees a connected execution path.
5. Exemplars: Linking Metrics to Traces
Another important advance is the ability to connect aggregate metrics to specific trace examples.
For example, a dashboard may show:
p99 latency = 2.4 secondsBut the engineer or AI needs to know:
Which actual request was slow?
What did that request do?
Which span caused the delay?
OpenTelemetry metrics support exemplars containing trace and span association fields, and Prometheus/OpenMetrics interoperability includes exemplar conversion rules.
For AIOps, exemplars are powerful because they bridge:
Metric anomaly → actual trace → logs from same request → root causeThat reduces guesswork.
6. Native Histograms and Better Latency Data
AIOps needs good latency distribution data, not just averages.
Average latency hides problems.
Example:
Average latency: 120 msThat sounds fine, but the distribution may be:
95% of requests: 80 ms
4% of requests: 400 ms
1% of requests: 8 seconds
The 1% tail may be where real user pain exists.
Prometheus native histograms improve how latency and distribution data can be represented, and Prometheus native histograms with standard schemas can map to OpenTelemetry exponential histograms.
For AIOps, this improves:
anomaly detection
SLO burn analysis
performance regression detection
capacity planning
tail-latency investigation
AI needs distribution-aware telemetry to avoid drawing conclusions from misleading averages.
7. Telemetry Pipelines and Data Processing
Another major advance is the rise of programmable telemetry pipelines.
The OpenTelemetry Collector can receive, process, and export telemetry, and its processors can transform, filter, and enrich telemetry as it flows through a pipeline. Grafana Alloy also provides pipelines for telemetry signals such as Prometheus and OpenTelemetry, with support for logs, metrics, traces, and profiles.
This is vital for AIOps because raw telemetry is often messy.
You need to:
drop noisy fields
redact secrets
normalise labels
add environment metadata
add ownership information
route critical data differently
sample high-volume traces
preserve error traces
enrich logs with Kubernetes metadata
convert vendor-specific formats
For AIOps, the telemetry pipeline becomes the data preparation layer.
Bad pipeline:
AI receives noisy, inconsistent, high-volume telemetry.Good pipeline:
AI receives enriched, normalised, relevant operational evidence.That is the difference between useful AIOps and expensive confusion.
8. Continuous Profiling
Continuous profiling is another big step forward.
Metrics tell you that CPU is high.
Profiles tell you which code path is consuming CPU.
OpenTelemetry describes profiles as answering which code is responsible for consuming resources, complementing logs, metrics, and traces. The OpenTelemetry Profiles specification describes profiles as an emerging fourth observability signal alongside logs, metrics, and traces. Grafana Pyroscope describes continuous profiling as a systematic method for collecting and analysing performance data from production systems.
For AIOps, profiling helps move from:
The service is slow.to:
The service is slow because 63% of CPU time is spent in JSON serialisation
inside checkout-api after the latest release.
That is much closer to actionable root cause.
9. eBPF-Based Observability
eBPF has significantly improved infrastructure and network observability.
Cilium describes itself as an eBPF-based solution for networking, observability, and security, providing visibility into workload connectivity. Hubble, built on Cilium, uses eBPF to provide dynamic visibility with detailed insight where needed.
For AIOps, eBPF is valuable because it can observe behaviour at the kernel and network layer without requiring every application to be perfectly instrumented.
It can help answer:
Which pod connected to which service?
Where are packets being dropped?
Is DNS failing?
Is the issue L3, L4, or L7?
Is network policy blocking traffic?
Is the service reachable?
Which process opened this connection?
This is especially important for Kubernetes, OpenStack, service mesh, GPU clusters, and distributed storage platforms.
For your type of environment, eBPF observability is particularly relevant because many failures happen below the application layer:
Neutron networking
Kubernetes CNI
DNS
load balancing
firewalling
pod-to-pod connectivity
GPU node networking
Ceph traffic
Slurm controller-to-worker communication
10. Topology-Aware Observability
AIOps cannot do strong root-cause analysis if it does not understand relationships.
It needs topology.
Example:
frontend
  depends on checkout-api
    depends on postgres
      runs on k8s-worker-03
        uses ceph-volume-17
          backed by osd-4
            runs on storage-node-02
This lets AIOps understand blast radius.
Without topology, AI sees isolated symptoms:
frontend errors
checkout latency
database timeout
Ceph OSD warning
node disk latency
With topology, it can infer:
Ceph OSD degradation on storage-node-02 is affecting postgres,
which is causing checkout-api latency and frontend errors.
This is one of the areas where observability has had to evolve from charts into graph-based operational context.
11. Change-Aware Observability
Most incidents are caused by change.
AIOps becomes much more effective when observability includes change events:
deployments
config changes
Terraform applies
Ansible runs
Kubernetes rollouts
OpenStack reconfigures
package upgrades
certificate renewals
DNS changes
firewall changes
feature flags
autoscaling events
AIOps needs to answer:
What changed before the incident?
Who changed it?
Was it automated?
Which services were affected?
Has this change caused problems before?
This is where GitLab, GitHub Actions, ArgoCD, Terraform, Ansible, Kubernetes events, OpenStack events, and audit logs become part of observability.
For example:
10:01 GitLab deployed checkout-api v2.4.1
10:03 pods restarted
10:04 p99 latency increased
10:05 HTTP 500s increased
10:06 SLO burn alert fired
The likely root cause is not “high latency.”
The likely root cause is the deployment.
12. SLO-Based Observability
Another advance is the move from infrastructure-centric alerts to service-centric SLOs.
Old alerting:
CPU > 90%
Disk > 80%
Pod restarted
Node memory high
Better alerting:
Checkout API availability below SLO
Payment latency budget burning too fast
Login error rate above user-impact threshold
For AIOps, SLOs provide priority.
Not every anomaly matters equally.
A CPU spike on a batch node may be fine.
A small increase in payment failures may be urgent.
SLO-based observability helps AIOps rank incidents by user impact rather than raw technical noise.
13. High-Cardinality and Dimensional Telemetry
Modern systems need dimensional analysis.
You need to slice by:
service
namespace
cluster
region
tenant
customer
version
endpoint
pod
node
GPU model
availability zone
database shard
queue
deployment
Prometheus uses a dimensional data model where time series are identified by a metric name and key-value labels, and PromQL allows teams to query, correlate, and transform time-series data.
For AIOps, dimensions are essential.
Instead of:
API latency is high.you want:
API latency is high only for:
service=checkout-api
version=v2.4.1
region=eu-west
tenant=customer-a
endpoint=/payment/confirm
That turns a vague incident into a narrowed investigation.
14. Better Log Structure
AIOps performs much better with structured logs.
Bad log:
Something went wrong while processing request.Better log:
{
  "level": "error",
  "service.name": "checkout-api",
  "trace_id": "abc123",
  "user_impact": true,
  "order_id": "redacted",
  "error.type": "DatabaseConnectionTimeout",
  "db.system": "postgresql",
  "k8s.pod.name": "checkout-api-7c9fd",
  "deployment.version": "v2.4.1"
}
Structured logs let the AI search, group, and correlate events reliably.
For AIOps, this is a major difference.
Unstructured logs require interpretation.
Structured logs provide evidence.
15. Observability for Automation
AIOps is not only about diagnosis. It also needs verification.
Before remediation:
Is the service unhealthy?
What is the likely root cause?
Is the proposed action safe?
After remediation:
Did the error rate fall?
Did latency recover?
Did the pod restart cleanly?
Did the SLO burn rate stabilise?
Did the same alert return?
Observability provides the feedback loop for automation.
Without observability, automation is blind.
A mature AIOps loop looks like this:
Detect
  ↓
Correlate
  ↓
Diagnose
  ↓
Recommend
  ↓
Approve
  ↓
Execute
  ↓
Verify
  ↓
Learn
The “verify” and “learn” stages depend heavily on observability.
16. AI-Readable Operational Context
The latest practical advance is making observability data usable by AI agents.
That means exposing operational systems through APIs, query layers, or protocols such as MCP-style tool access.
The AI needs controlled access to:
metrics queries
log search
trace lookup
profile analysis
Kubernetes state
OpenStack state
Slurm queue state
Ceph health
GitLab deployments
Ansible runbooks
incident history
service ownership
This turns observability from something humans look at into something AI can query and reason over.
For example:
User asks:
"Why did gpu-test-01 fail to start?"

AI queries:
OpenStack state
Nova logs
Neutron events
Prometheus GPU metrics
Slurm state
Kubernetes GPU operator status
Ceph health
recent config changes

AI replies:
"Nova failed to schedule the VM because the requested PCI alias is not defined.
Neutron and storage are healthy. The failure is isolated to Nova PCI configuration."
That is observability becoming operational intelligence.
How These Advances Make AIOps Effective
The relationship is simple:
| Observability advance | What it gives AIOps |
|---|---|
| OpenTelemetry | Standard telemetry collection |
| Semantic conventions | Consistent metadata |
| Metrics | Quantitative system health |
| Logs | Event-level explanation |
| Traces | Request-level causality |
| Profiles | Code-level resource attribution |
| Exemplars | Link from metric anomaly to trace |
| eBPF | Kernel/network visibility |
| Topology | Dependency and blast-radius context |
| Change events | “What changed?” analysis |
| SLOs | Business/user-impact priority |
| Telemetry pipelines | Clean, enriched, governed data |
| Structured logs | Machine-readable evidence |
| Automation feedback | Safe remediation verification |
For Your OpenStack / Kubernetes / Slurm / GPU Homelab
For your environment, the observability stack that would make AIOps effective should include:
Metrics:
Prometheus / Mimir

Logs:
Loki

Traces:
Tempo

Profiles:
Pyroscope

Collection and pipelines:
OpenTelemetry Collector or Grafana Alloy

Dashboards and exploration:
Grafana

Alerting:
Alertmanager

Kubernetes network observability:
Cilium / Hubble / eBPF

Change context:
GitLab CI/CD, Ansible logs, OpenStack reconfigure events

Infrastructure state:
OpenStack, Nova, Neutron, Glance, Cinder, Ceph

GPU/HPC state:
Slurm, NVIDIA DCGM exporter, nvidia-smi, GPU Operator if using Kubernetes

Automation:
Ansible playbooks with human approval

AI access:
MCP-style tool interface to query metrics, logs, traces, infrastructure, and runbooks
The important design principle is:
Do not just collect telemetry.
Make telemetry correlated, structured, enriched, searchable, and safe for AI to use.
That is what turns observability into a real AIOps foundation.