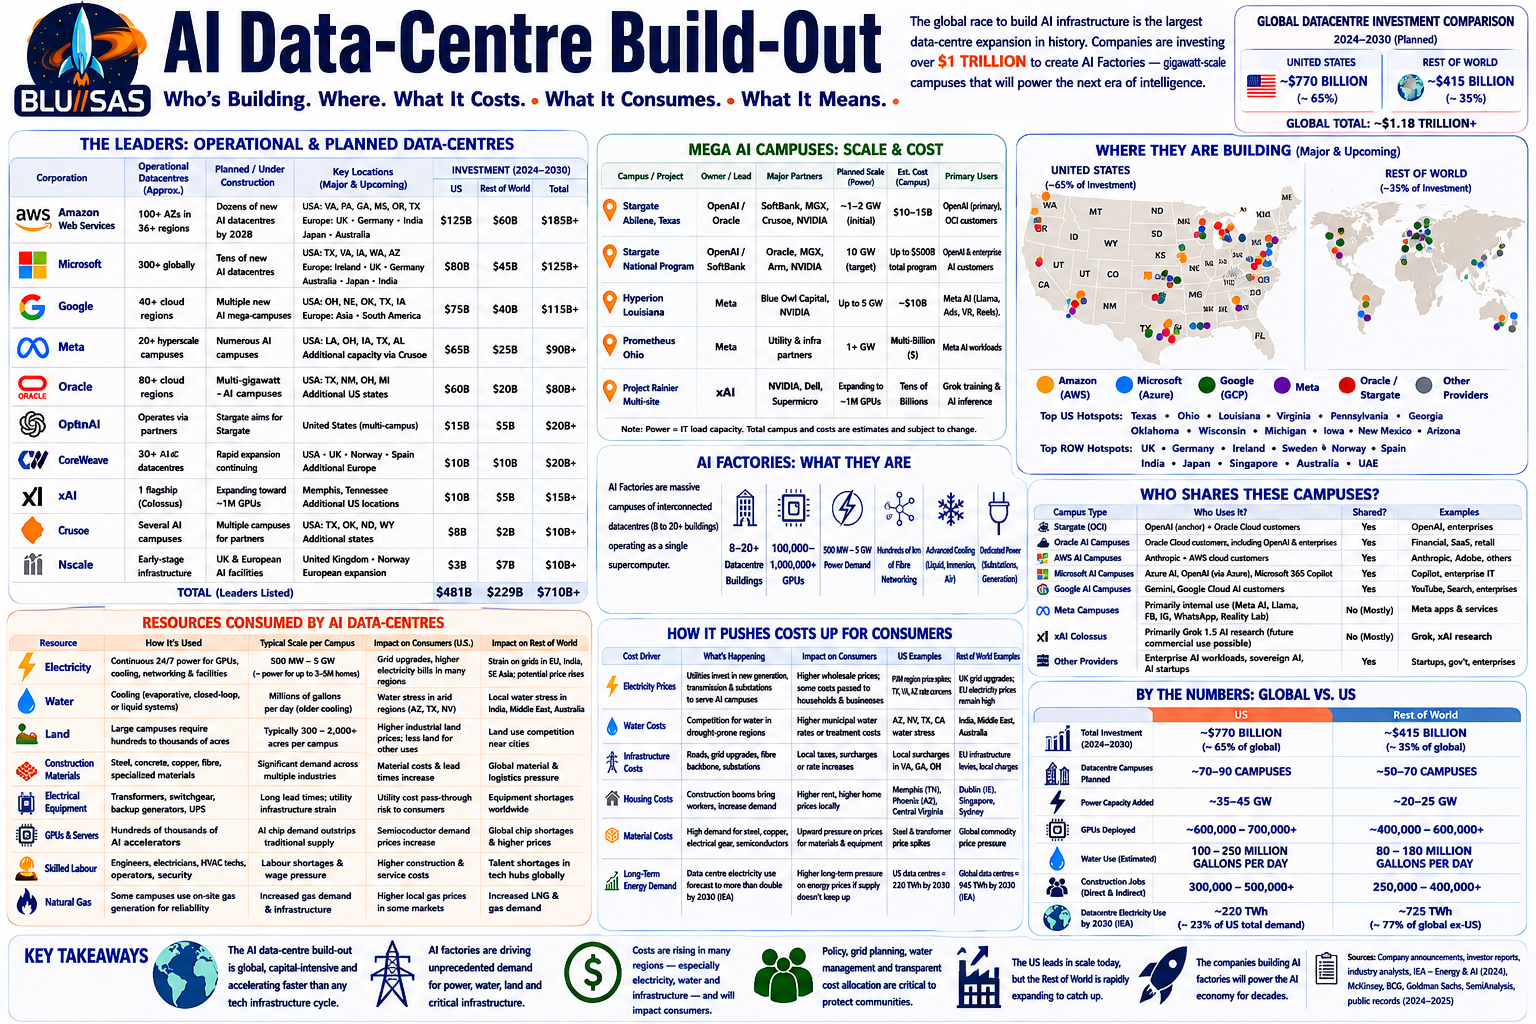
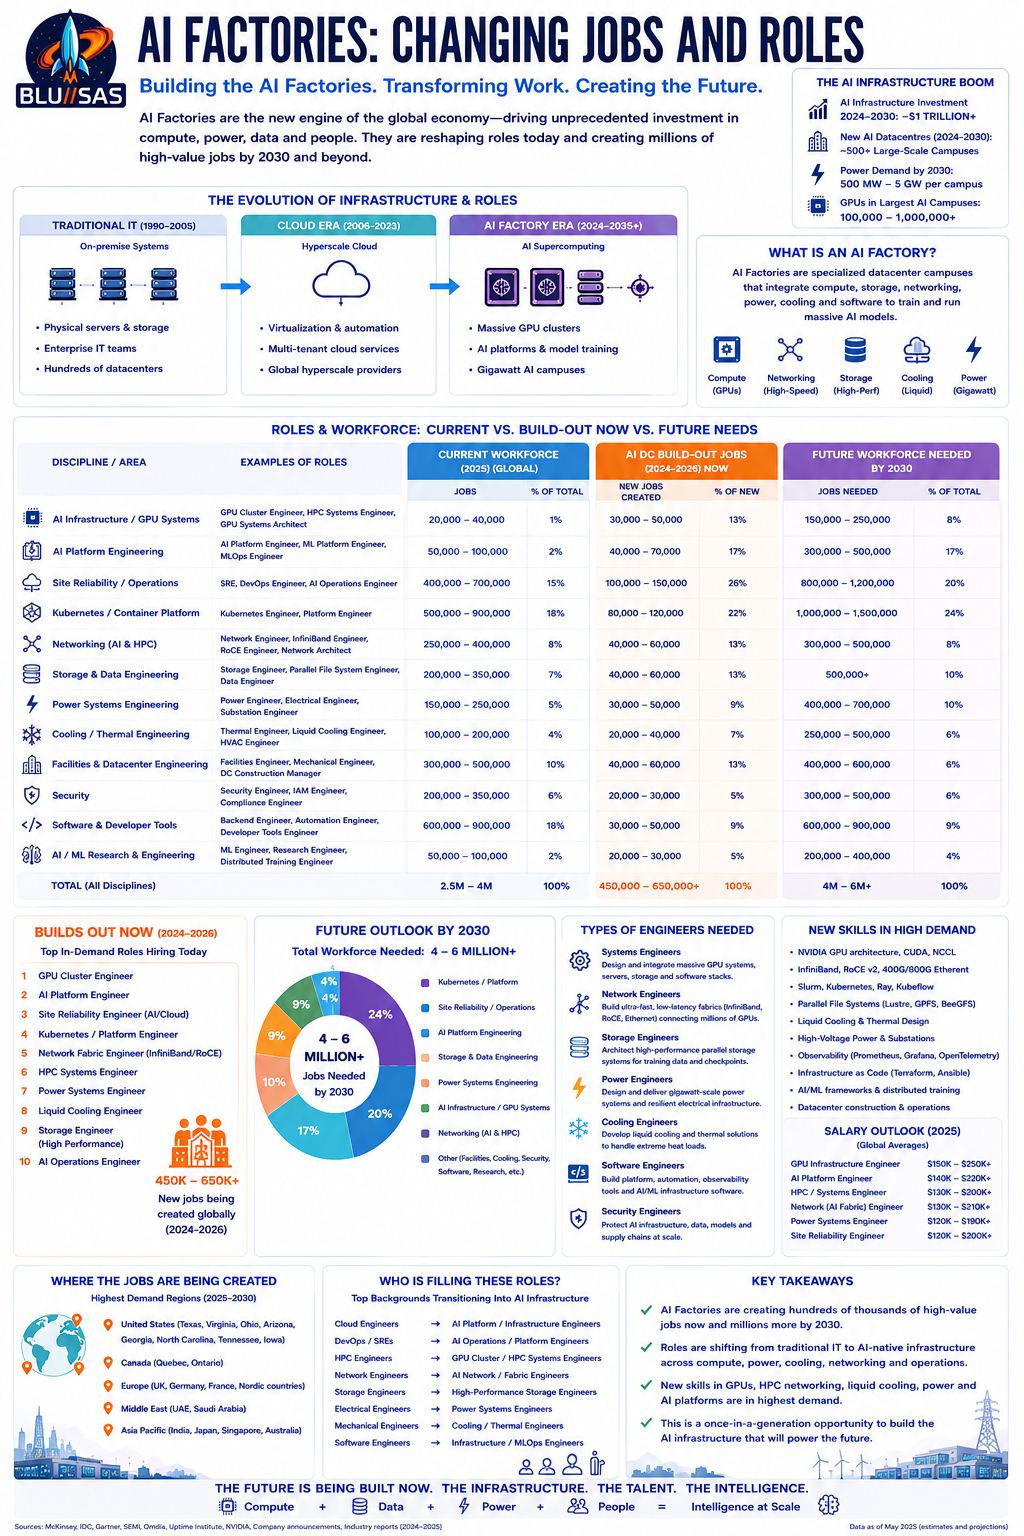
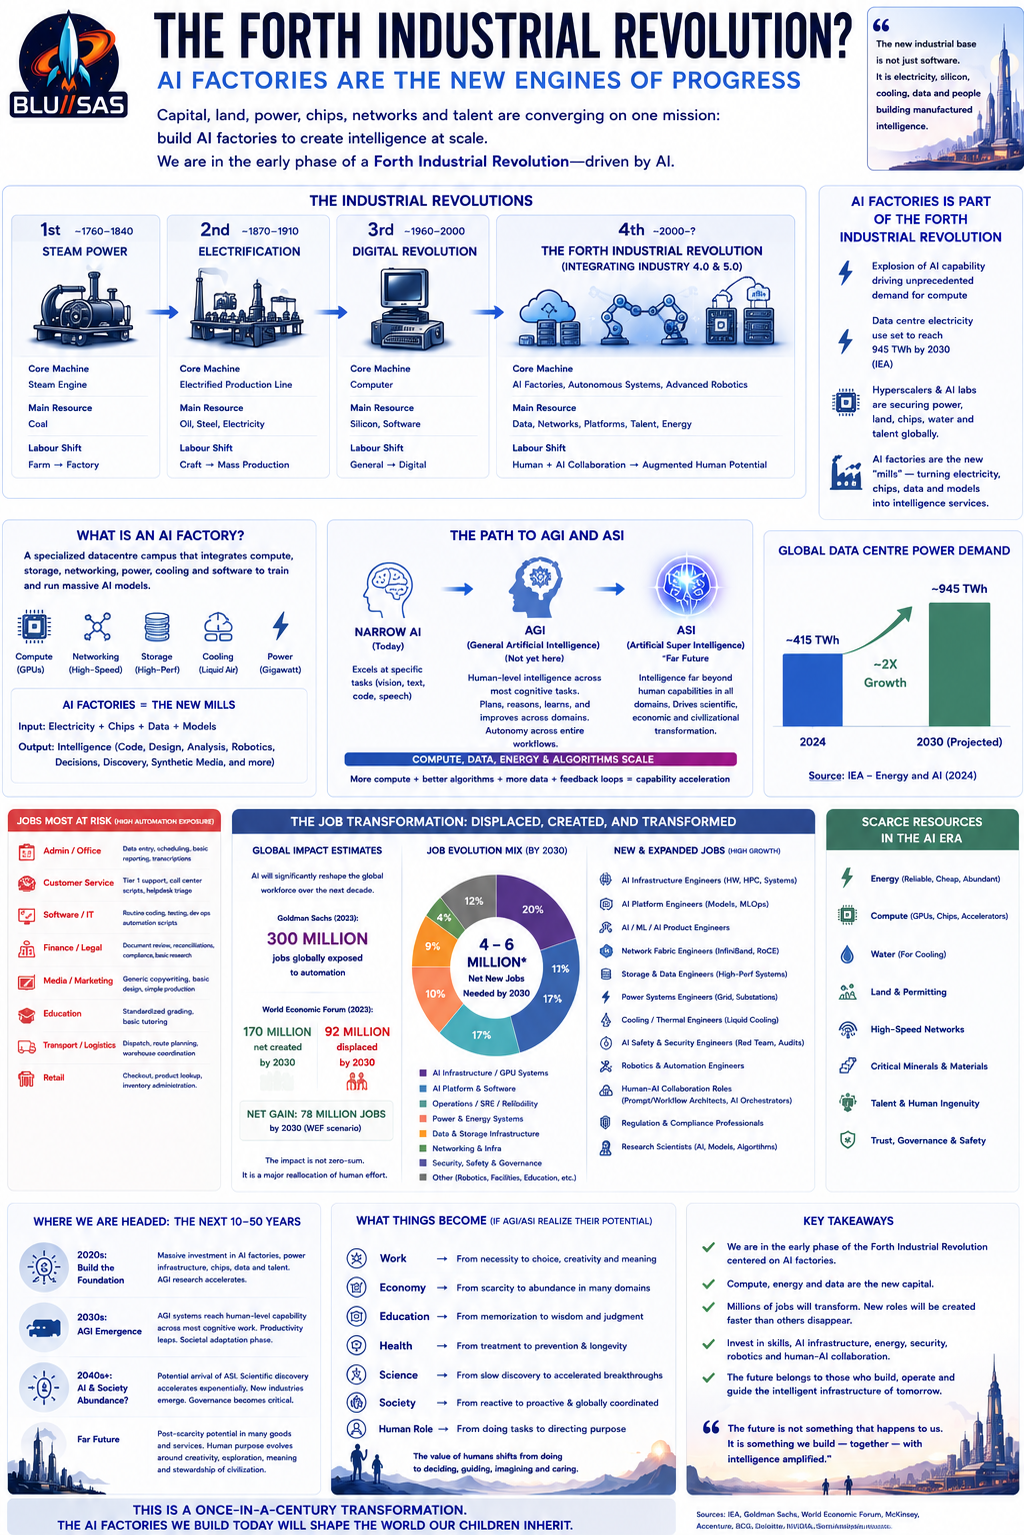
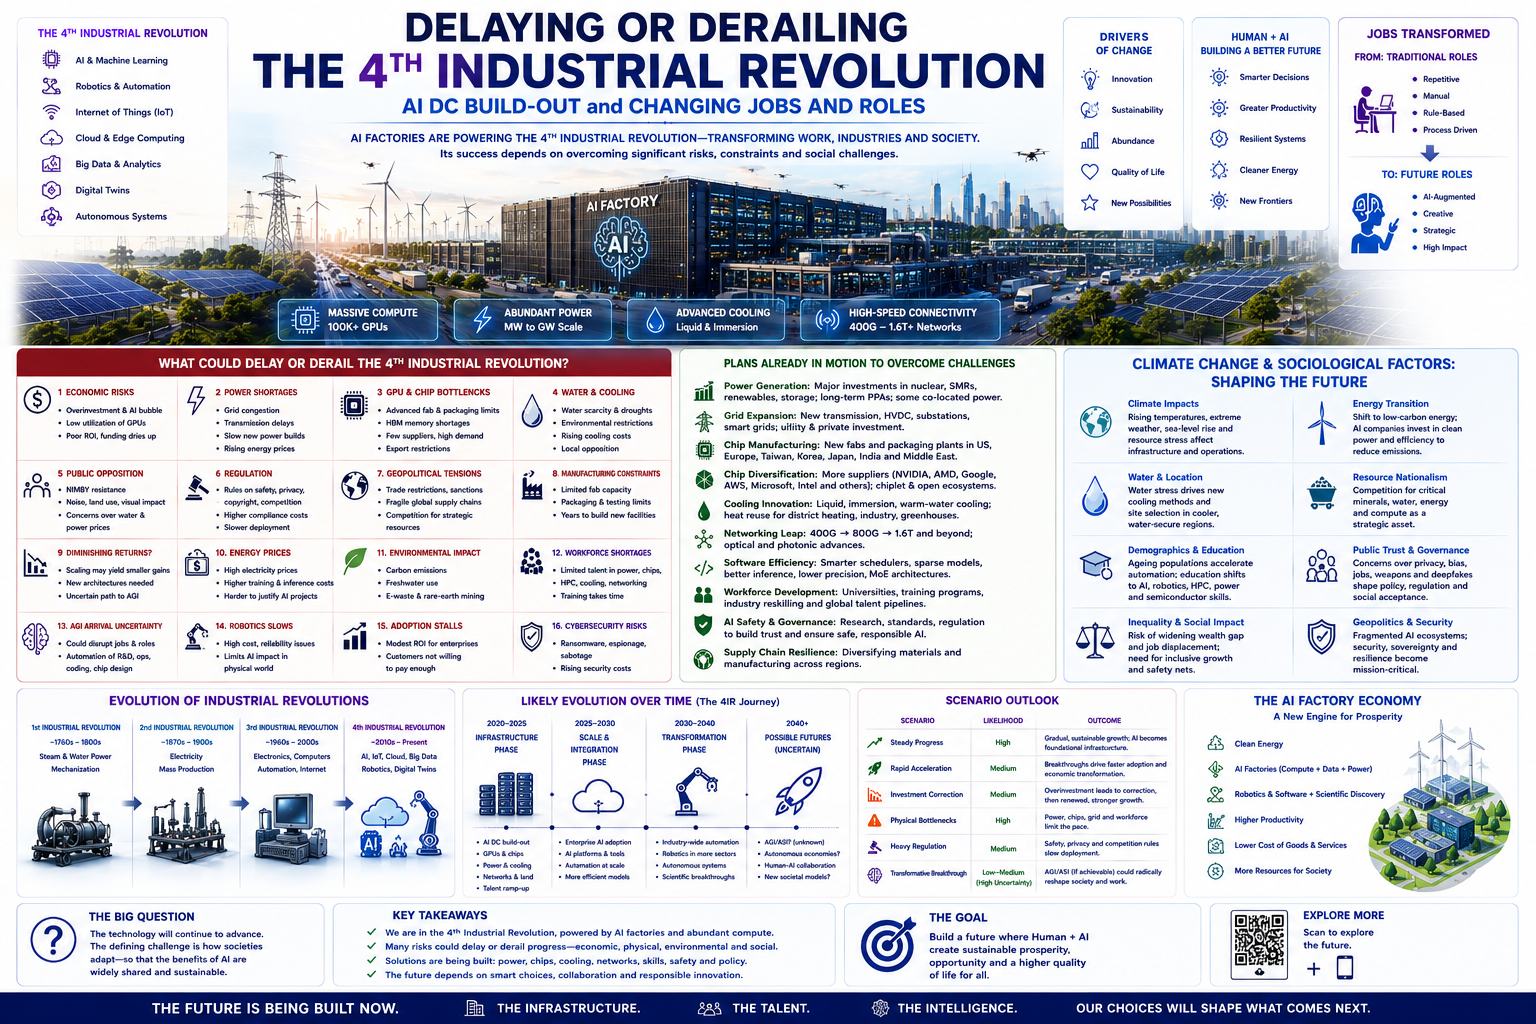
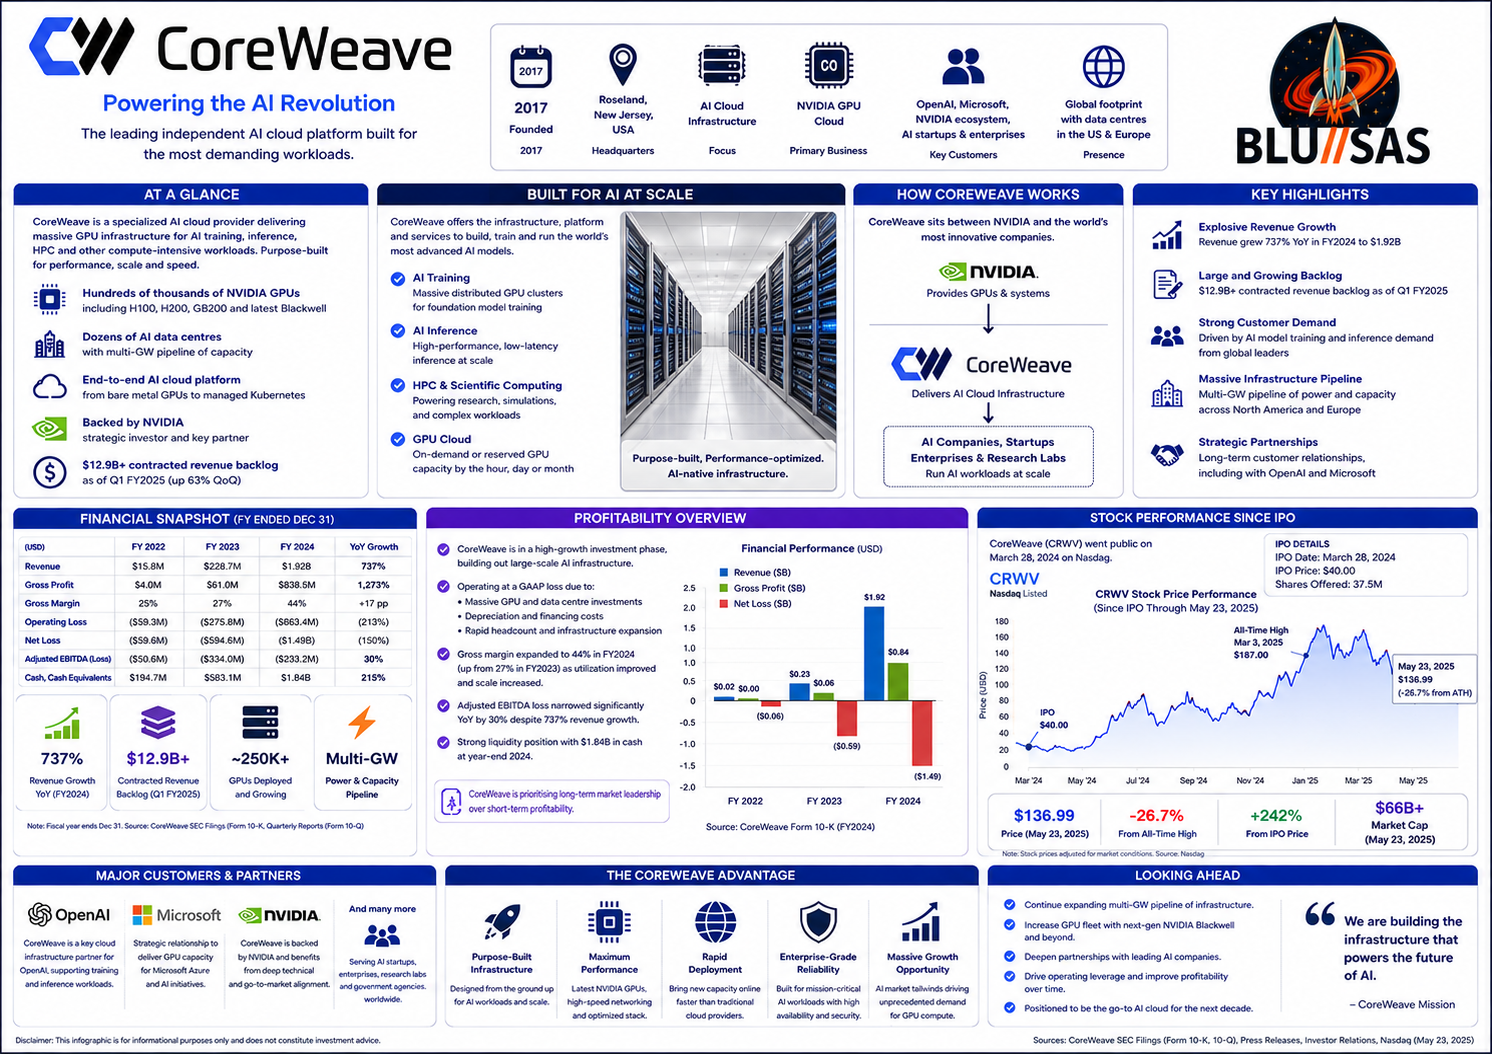
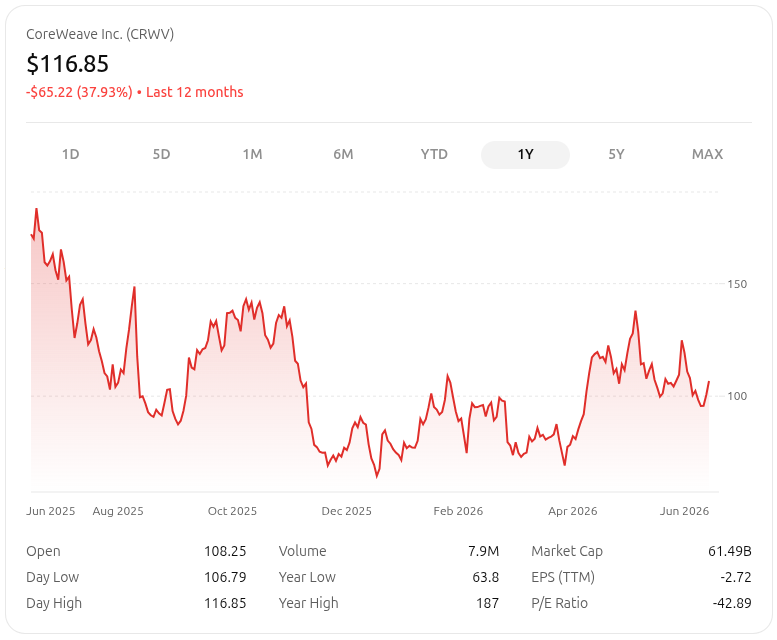
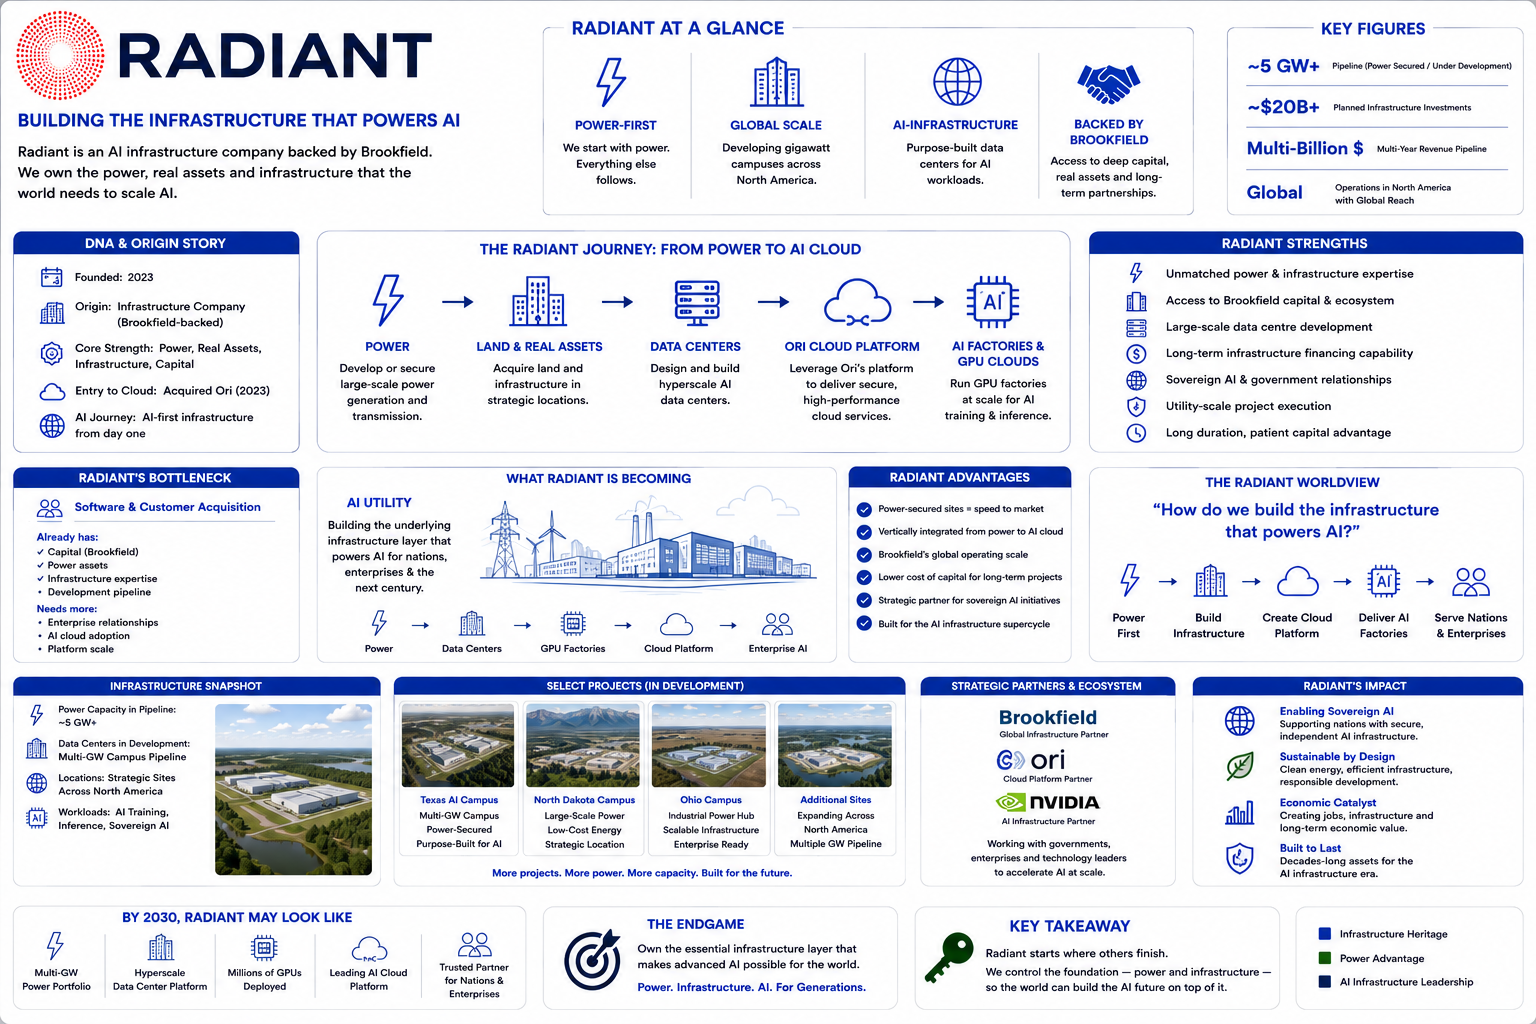
Towards the tailend of last year – September 2025 onwards – was when I started using AI (ChatGPT) for my work. It was the internal ChatGPT approved by Oracle, so now and again I would ask it a questions related to my work.
After a couple of questions, I asked it this question: Will AI take over and put me out of a job? Knowing it could not really lie and I was curious to see what it said with the follow up question: What shall I do now to prepare for when AI makes my role redundant…
The answer then as it will be the same but a little less specific if I asked these questions now – that is, it told me it was hard to say – it all depends on what my job is now, and it listed the jobs/roles that would be most affected by AI. As for the “what should I do in preparation – for when AI takes my job” – it told be to become an AI evangelist!
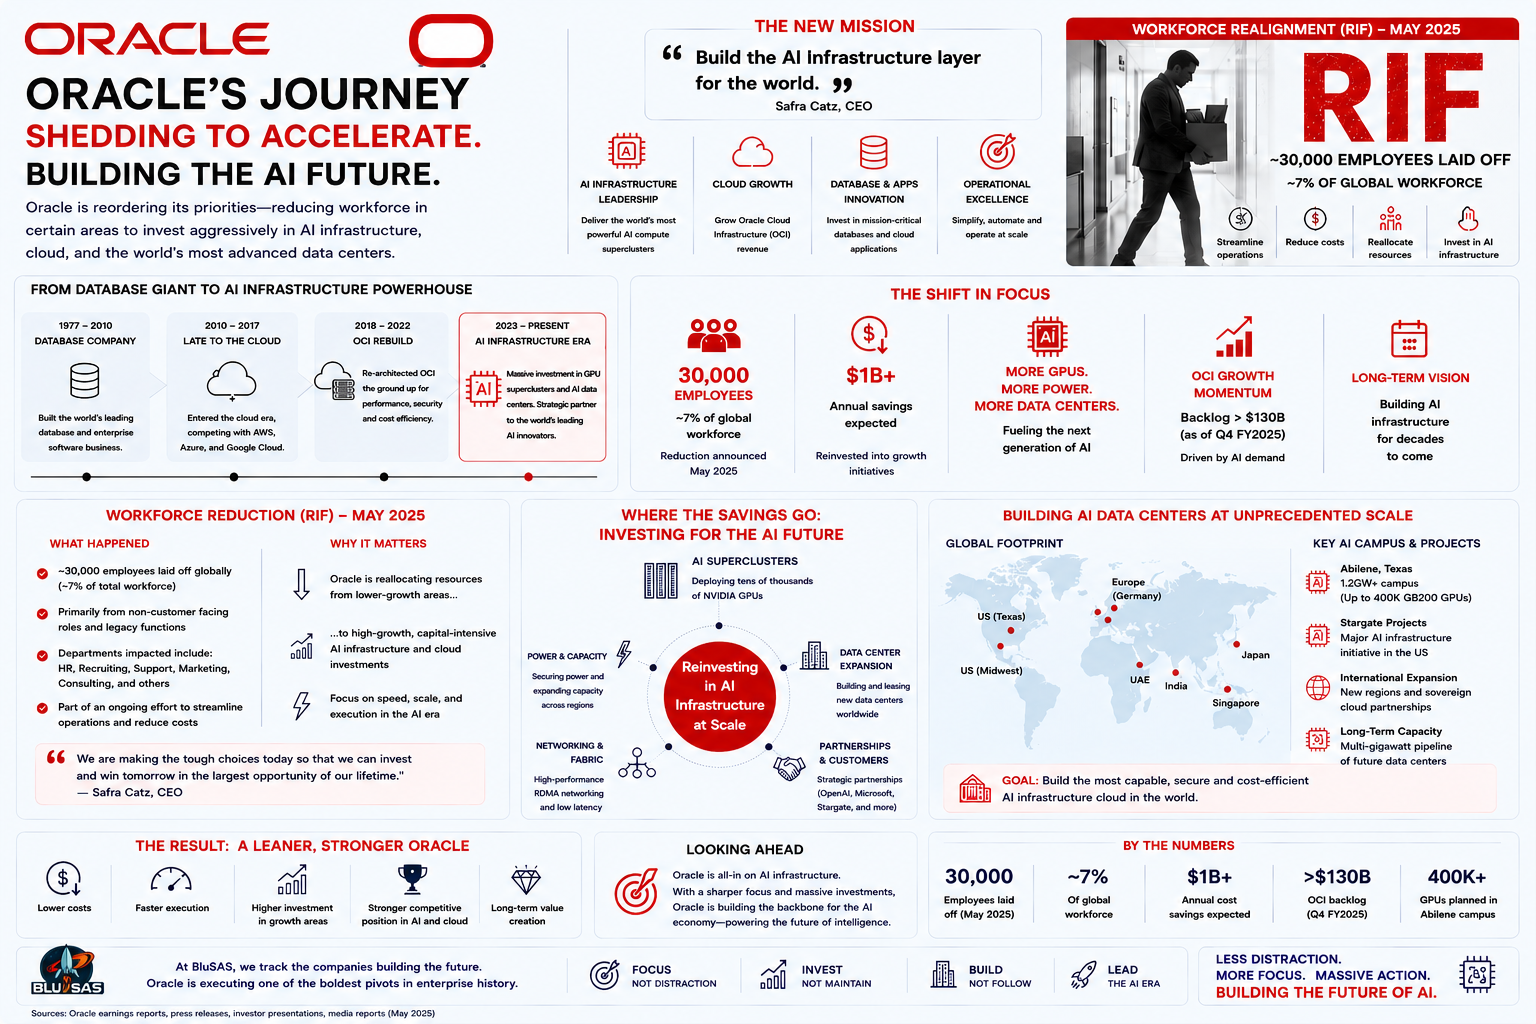
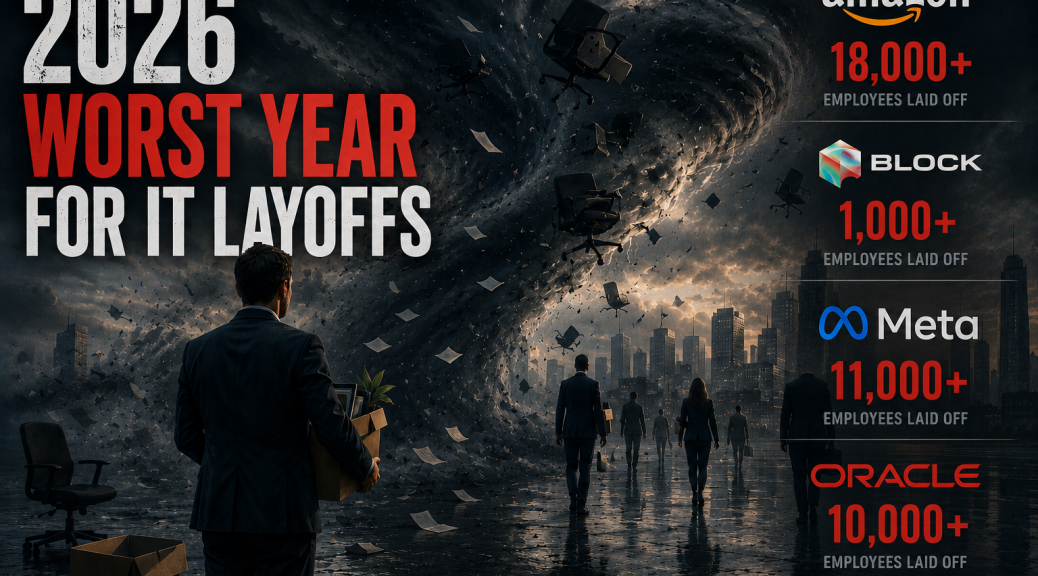
September 2025 was bad at Oracle (and it has been ever since) – there were threats of mass RIF (reduction in force) and the threats did materialise into lots of fellow Oracle employees in India and the US getting laid off. The UK was spared, but the impending doom of RIF was demoralising and people did not, for one moment, thought they were safe as it was all over. Personally, for me I was not hopefully – in fact more the opposite as I had been laid off from Cisco Meraki previous to getting this role at Oracle, so I needed to do something about it now.
I wasn’t going to leave it to chance to be laid off twice, so I starting looking for new roles enabling me to leave before the next round of redundancies. I applied for roles in the SRE and Observability area especially as I liked working as a Observability SRE with Cisco Meraki before being “reduced” prematurely! By the way, Oracle started the RIF process to raise capital expenditure (CapEx) for their AI expansion – the Abilene DC in Texas. They made redundancies where they can to reap the most amount of CapEx – there is no other reason why an individual is made redundant apart from raising as much money from their departure as possible…
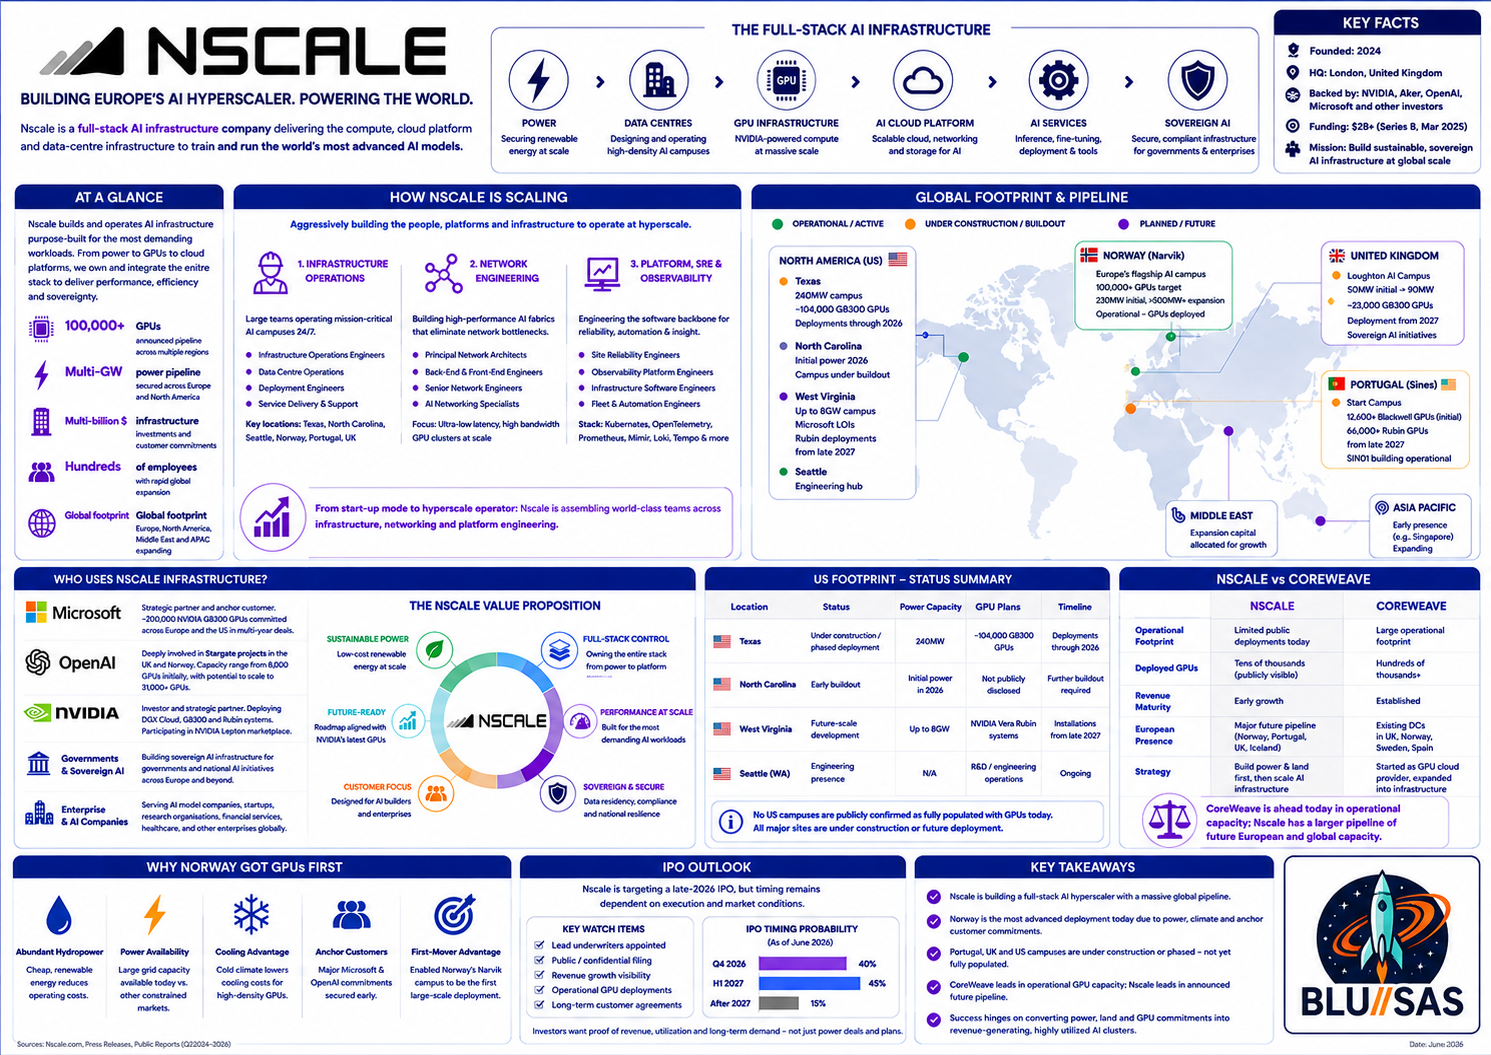
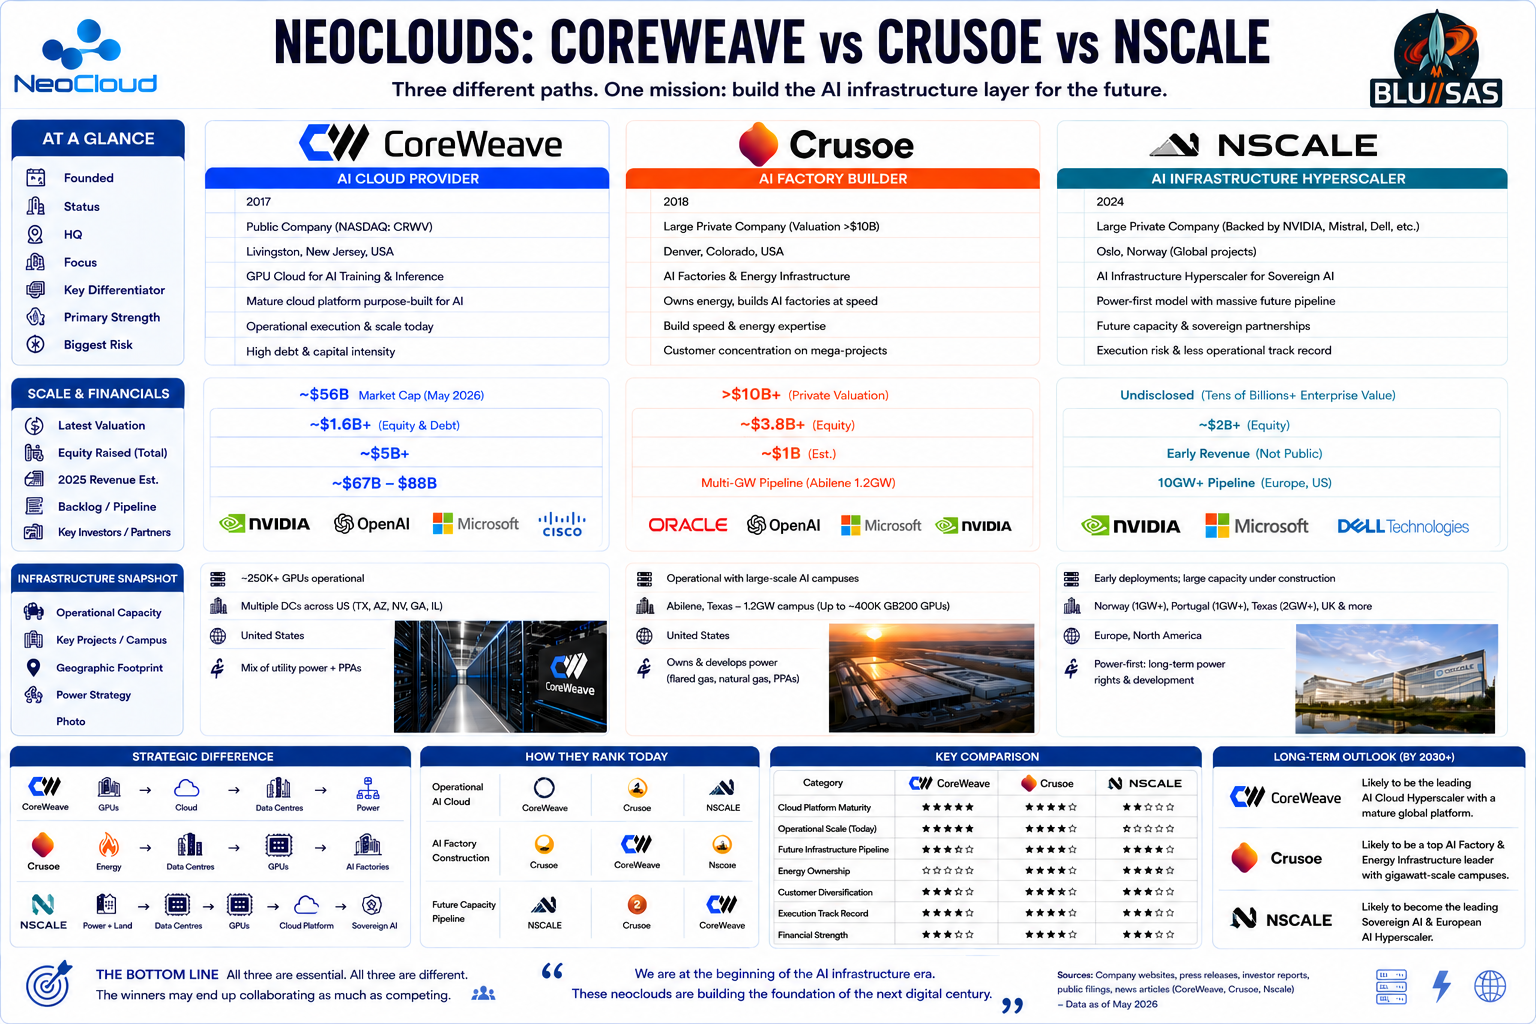
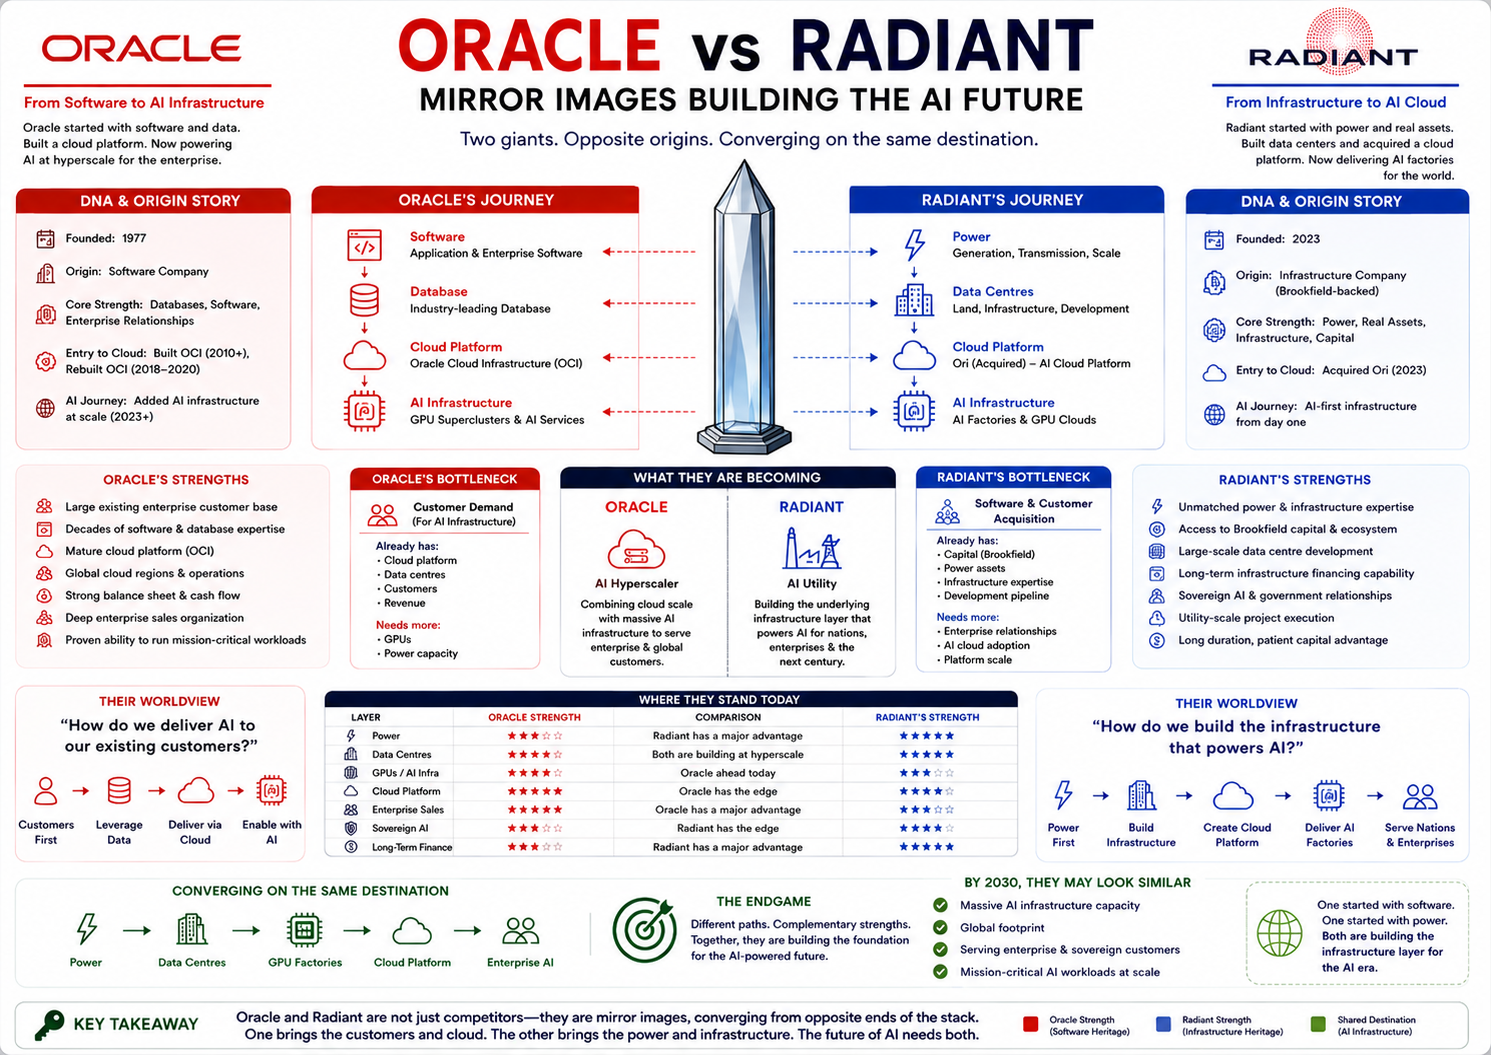
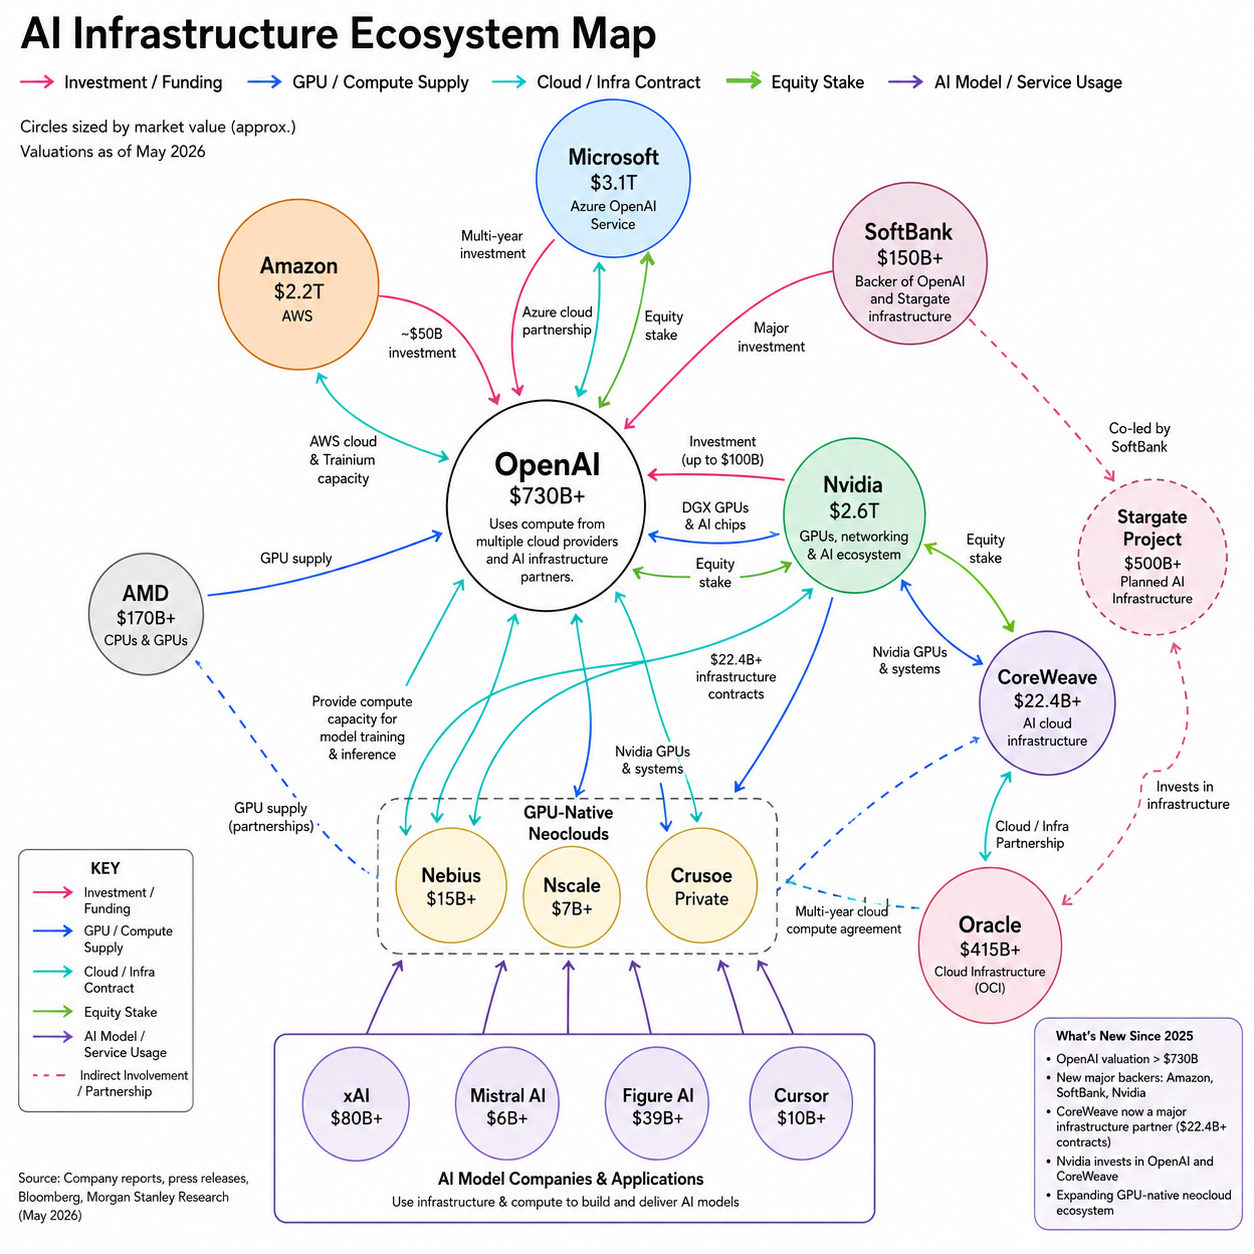
To my surprise, two such roles appeared – one at Graphcore and one at Nscale. Both of these companies have a close but differing relationship with AI. I interviewed with both using standard and usual preparation techniques with no help from AI. I was offered a role by Nscale but was rejected by Graphcore. I accepted the role at Nscale and once the contract was signed and handed in notice at Oracle – serving a 1 month notice period before joining Nscale in mid-December of 2025.
Use of AI at Start-ups like Nscale
It is of no surprise that the use of AI has been adopted by small companies and start-ups who need to move fast, launch products, and perform support, sales and marketing tasks fast. AI allows you to do this. One moto at Nscale is to move fast and that good is good enough – don’t let perfection slow you down or halt your progress. With the use and help of AI – in all areas of a start-up company – it will allow you to do this with minimal resources and little time.
I found, on joining Nscale, all employees had access to ChatGPT and could ask for access to Claude, and were encouraged to use AI for all aspects of our work. The company were also using modern applications with AI built-in or enabled so were also encourage to use that AI. For example, traditional applications such as Jira and Confluence were replaced by Linear and Notion. These had AI native functions and behaviour which would speed-up or automate your work. They also integrate with each other and other applications such as Slack and Gmail to enable you to combine AI queries across multiple sources of information.
I joined as an Observability Platform Engineer expecting, as part of my roles, to be creating dashboards and alerts with my skills and experience. But no, AI replaced all of this such that any engineer (without o11y skills or Grafana experiences) could ask AI to simply “create me a dashboard to show the latency of X, Y and Z and associate an alert when X, Y, and Z crosses a threshold of A, B or C” – for example. AI would be able to have a very good attempt at doing this very fast (minutes instead of hours). It seems like I was already out of a job before I even started…
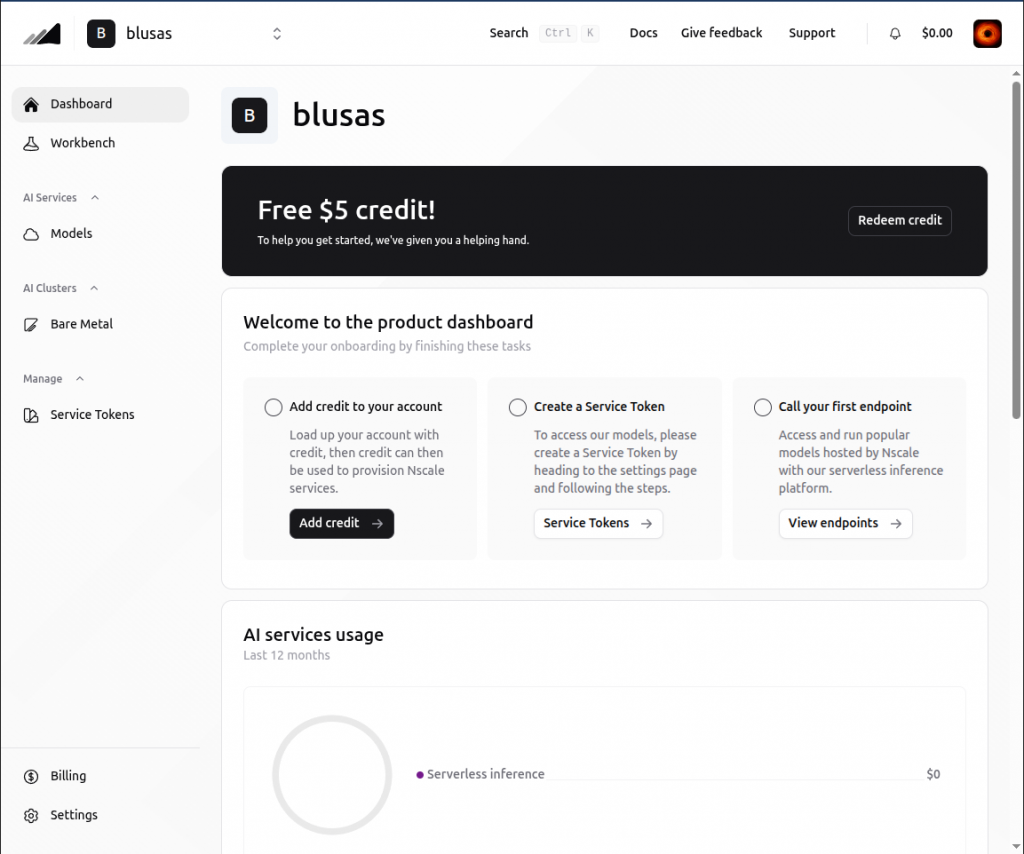
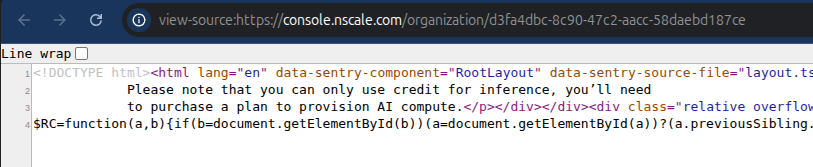
Not surprisingly, as the weeks rolled on at Nscale, the use of AI was very apparent, with each Engineering Weekly meeting having a demo that sang the praises of how AI helped with creating a useful or needed feature or solution in a short amount of time. Later, as I used AI to create applications, I recognised or realised that ALL if not most of the Nscale applications, interfaces, and features were created using AI. The UI to their console is a big give away:
No human would write their code on a a few lines!
All Nscale employees were “faking it until they made it” and using AI to help them do so fast. I found that apps like Notion enables you to use AI to find info, detail and documentation really readily and will also summarise and condense information for digesting in a short amount of time – no more tl;dr – get AI to summarise and read the pertinent snippets…
Addictive Nature of AI
First lession learnt after using AI for work (and also for anything else) is that it is addictive – once you’ve used it and found it helpful – it is hard to not use it and go back to how you use to do things albeit a slower and more laborious.
It’s like using a calculator – if you use it for everything, you lose the skill of doing mental arithmetic and come to depend of it to do the all the calculations. If you imagine AI as a super super magical calculator that can help you solve and perform all your work tasks – it will become addictive and the more you use, the more skills you will lose and the more dependent on it you become…
How does an employee get appraised if AI is doing all the work? It comes down to your manager, and unfortunately, after 2.5 months at Nscale, I was transferred to a new manager who didn’t like the look of me and extended my probation period – setting me up to fail so that he could easily dismiss me during this probation period without causing an issue with the company. So after 4.5 months with Nscale, I was let go.
AI Addiction becomes a habit
Once I knew how to use AI and take advantage of its features and limitations – it was hard to not use it. There are so many areas where it could lighten the burden of tedious work and speed up tasks 10 to 100 times. The first thing to use AI for after been made unemployed is to find a new role and/or job.
 role = what you actually do and how you do
 job = formal title and place in the company
 ATS = applicant tracking system
I started out seeking a new job by setting up a spreadsheet to keep track of my job applications – I knew the job market was going to be a lot tougher than the previous two period of unemployment, so I named this sheet appropriately!
Start off on the right foot by using the “Framing” method – or more specifically strategic naming or linguistic framing. Or strategic framing through naming.
It means choosing a project, programme, policy, or initiative name that shapes how people interpret it before they examine the details. A well-chosen name can influence support, behaviour, priorities, funding, and perceptions of success. Expecting and knowing how tough the job market is I turned job hunting into a “mission” and this certainly influenced my way of working – kicking in my resourcefulness, resourceful thinking and greater innovation
The Resourceful Use of AI
The first and best reason to use AI is: if AI is the cause of your redundancy, then why not use it to attain a new job/role? If AI is really taking over the world (or decimating roles in IT) then your should be able to use it to your advantage to find a suitable role and in turn attain a job with a company.
In a tough job market you will have to apply for many roles, suffer a lot of rejections, ghosting, and no replies to job applications, and this is before you are invited to an interview with a human (companies are using AI interviewers now to the amount of applications!)
AI can help most if you use it to reduce admin, improve targeting, and sharpen your pitch rather than to mass-apply for roles. The biggest wins are tailoring CVs to each role, drafting outreach messages, organizing applications, and preparing for interviews faster.
The use of AI to improve your CV/Resume for ATS is necessary nowadays just to get a talent advisor or recruiter to initiate a contact with you. Without this contact you will just fall wayside and not be seen by anyone – human or AI.
Use AI to Generate Interview Questions
In this latest search for jobs, once I have lined up an interview, I gave AI the JD of that particular role and my CV and simply asked it to give me 10-30 interview questions between basic and advanced level that the interviewer was most likely to ask me.
Although this technique is not foolproof, it is as good as IF the interviewer (new to the task and having lots of candidates to interview or screen) has also used AI to formulate the list of interview questions!
Use AI for Interview Practise
AI could also be instructed to simulate an interview sessions where you could give realtime replies for it to ask you further questions on your answers and give you feedback at the end. I never did this so I can’t really comment but this would be super useful to get interview experience. If you have worked for one company over a long period of time, then not only the job market has changed, but you are also out of practise and rusty at doing well in an interview…
Personally, I use the first few interviews as practice – I would never rely of the first three interview to result in a job offer – I woud also want them to be tough so that they reveal my weaknesses so I can improve. If their is an option to transcribe the interview session, then do that with the intension of handing that to AI to analyse and give suggestions on the improvements.
I never got to this stage, but potential I could have been desperate enough to resort to this if my period of unemployment continued for a while and I was getting no successes at attaining interviews and job offers (at any salary where I could get into “temporary” employment while carrying on with the job search for a more suitable role).
Use AI to Learn and Improve
I think this is the best use of AI – to learn and improve your skills, knowledge and experience during times of unemployment and working your “Mission for a New Role” strategic framing project!
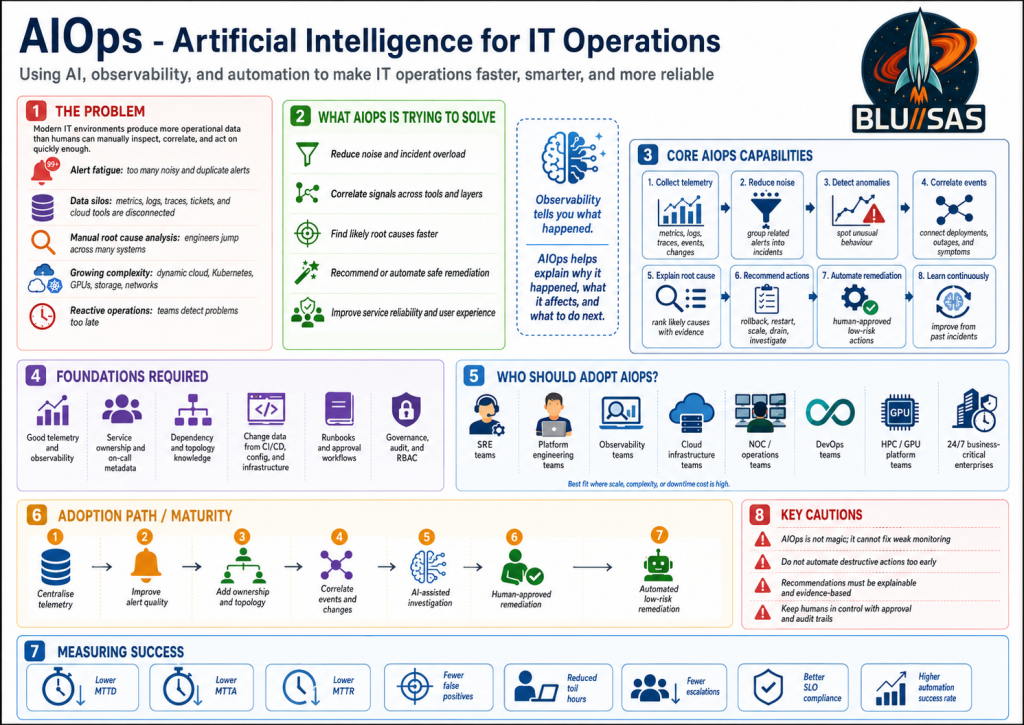
AIOps stands for Artificial Intelligence for IT Operations. It is a methodology for using machine learning, statistical analysis, automation, and now LLM-based reasoning to improve how infrastructure and application operations teams detect, investigate, explain, and resolve problems.
At its core, AIOps is trying to solve a very practical problem:
Modern systems produce more operational data than humans can manually inspect, correlate, and act on quickly enough.
That includes metrics, logs, traces, events, alerts, tickets, deployments, topology changes, CI/CD activity, cloud audit logs, Kubernetes events, OpenStack state, Slurm queues, GPU telemetry, network flows, and user-impact signals.
1. The Problem AIOps Is Trying to Solve
Modern IT operations has become too complex for purely manual troubleshooting.
A typical platform may include:
Users
  ↓
Load balancers
  ↓
Ingress / API gateways
  ↓
Kubernetes services
  ↓
Microservices
  ↓
Databases / queues / object storage
  ↓
Cloud / OpenStack / VMware / bare metal
  ↓
Networks / firewalls / DNS / storage / GPUs
Every layer emits telemetry. The problem is not lack of data. The problem is too much disconnected data.
Problem 1: Alert Fatigue
Operations teams often receive hundreds or thousands of alerts.
Many are:
duplicates
symptoms rather than root causes
low priority
transient
missing context
caused by the same underlying event
Example:
Disk latency high
API latency high
Pod restart count high
Database connection errors
Frontend 500s
SLO burn rate alert
User complaints
A human has to determine whether these are six separate incidents or one cascading failure.
AIOps tries to group these signals into one meaningful incident.
Problem 2: Data Silos
Metrics are in one place.
Logs are in another.
Traces are somewhere else.
Tickets are in Jira or ServiceNow.
Deployments are in GitLab or GitHub.
Infrastructure state is in OpenStack, Kubernetes, Slurm, Ceph, AWS, Azure, or VMware.
That is slow, error-prone, and dependent on tribal knowledge.
AIOps tries to connect these sources and reason across them.
Problem 3: Manual Root Cause Analysis
Traditional troubleshooting is often manual correlation.
An engineer asks:
What changed?
What broke?
Who deployed?
Which node is affected?
Is this network, storage, compute, DNS, auth, GPU, database, or app?
Has this happened before?
What fixed it last time?
That investigation may take 30 minutes, 2 hours, or several days.
AIOps attempts to reduce that investigation time by automatically correlating evidence.
Problem 4: Too Much Complexity
Modern platforms are dynamic.
Examples:
containers are rescheduled
pods are ephemeral
cloud instances appear and disappear
autoscaling changes capacity
CI/CD continuously deploys changes
service dependencies shift
storage volumes move
GPU nodes are drained, allocated, or isolated
network paths change
certificates expire
DNS records update
Humans are not good at mentally tracking all of that in real time.
AIOps tries to build a continuously updated operational view of the environment.
Evidence: - node db-03 stopped responding at 10:42 - API connection errors started at 10:43 - customer-facing 500s increased at 10:44
This is one of the biggest practical wins of AIOps.
3. Anomaly Detection
AIOps can learn normal behaviour and detect deviations.
Examples:
CPU usage normally peaks at 70%, now 95%
API latency usually 120 ms, now 900 ms
GPU memory errors normally zero, now increasing
Login failures normally 20/hour, now 5,000/hour
Network packet drops normally rare, now concentrated on one host
This is useful when static thresholds are poor.
A static alert might say:
CPU > 90%
But anomaly detection can say:
This service normally uses 15% CPU at this time of day.
It is now using 65%, which is abnormal for this workload.
The likely cause is not “latency high.” The likely cause is the deployment.
AIOps should connect those facts.
5. Root Cause Analysis
AIOps tries to identify the underlying cause, not just the symptoms.
Example:
Symptom:
Users cannot access the application.

Possible causes:
- DNS failure
- certificate expiry
- ingress failure
- pod crash
- database outage
- network ACL issue
- storage outage
- failed deployment

AIOps task:
Rank the most likely causes using evidence.
A good AIOps system does not just say:
Application is down.
It says:
The application is down because the ingress controller cannot reach the backend pods.
The backend pods are healthy, but the service selector was changed in the latest deployment.
That is operationally useful.
6. Recommendation
AIOps should recommend next actions.
Example:
Recommended action:
Rollback deployment checkout-api:v2.4.1 to v2.4.0.

Reason:
Errors started within 3 minutes of the deployment.
No infrastructure errors were detected.
Previous version had normal latency and error rate.
The recommendation should include evidence, not just a guess.
7. Automation and Remediation
At higher maturity, AIOps can automate approved actions.
Examples:
Restart a failed service
Scale a deployment
Rollback a release
Drain a bad Kubernetes node
Evacuate an OpenStack compute node
Restart a failed exporter
Open a Jira ticket
Page the correct team
Run a known Ansible playbook
Only mature, low-risk, well-tested actions should be fully automatic.
4. AIOps Compared With Traditional Observability
Traditional observability answers:
What is happening?
AIOps tries to answer:
What is happening?
Why is it happening?
What changed?
What is the blast radius?
What should we do next?
Can we fix it automatically?
Observability provides the evidence.
AIOps provides correlation, reasoning, prioritisation, and action.
They are not competitors. AIOps depends on observability.
5. AIOps in Your MCP Example
In the previous MCP example, the user asks:
Why did gpu-test-01 fail to start?
A traditional engineer might manually check:
openstack server show gpu-test-01
openstack console log show gpu-test-01
openstack port list
openstack hypervisor list
docker logs nova_scheduler
docker logs nova_compute
journalctl on compute nodes
sinfo
nvidia-smi
kubectl get pods
Grafana dashboards
Loki logs
Prometheus GPU metrics
An MCP-enabled AIOps agent could do much of this automatically.
It could query:
OpenStack MCP   → VM state, scheduler errors, Neutron ports
Nova MCP        → compute scheduling failure
Neutron MCP     → network binding or DHCP issue
Slurm MCP       → GPU node allocation or drain state
Prometheus MCP  → CPU, RAM, disk, GPU health
Loki MCP        → Nova, libvirt, Neutron logs
Kubernetes MCP  → GPU Operator / NVIDIA plugin status
Ceph MCP        → storage availability
Ansible MCP     → known remediation playbooks
Then return something useful:
gpu-test-01 failed because Nova could not schedule the requested PCI device.
The requested alias nvidia-gpu-audio is not defined in nova.conf.
The VM requested a GPU-related PCI alias that the scheduler cannot match.

Evidence:
- Nova API returned PCI alias nvidia-gpu-audio is not defined
- No matching pci_alias exists on the compute configuration
- Hypervisor is otherwise healthy
- Neutron port exists
- Image and flavor are valid

Recommended fix:
Add or remove the correct PCI alias definition, reconfigure Nova, restart nova-scheduler and nova-compute, then retry the server create command.
That is AIOps because the system has moved beyond raw monitoring and into assisted diagnosis.
6. The AIOps Methodology
AIOps is not just a product. It is a way of operating.
A practical methodology looks like this:
1. Instrument everything
2. Centralise telemetry
3. Normalise and enrich the data
4. Correlate events across systems
5. Detect anomalies
6. Identify service impact
7. Recommend actions
8. Automate safe remediation
9. Verify outcomes
10. Learn from incidents
The goal is continuous operational learning.
Every incident should improve the system.
7. The Maturity Model
AIOps adoption usually happens in stages.
Level 1 — Better Visibility
You collect metrics, logs, traces, and events.
Typical tools:
Prometheus
Grafana
Loki
Tempo
OpenTelemetry
Elasticsearch
Alertmanager
At this level, humans still do most of the reasoning.
Level 2 — Alert Correlation
You start grouping alerts into incidents.
Example:
20 alerts → 1 incident
This reduces noise and improves response time.
Level 3 — Assisted Investigation
The system helps engineers investigate.
It can answer:
What changed?
What services are affected?
Are there similar previous incidents?
Which logs matter?
Which deployment caused this?
This is where LLMs and MCP become very useful.
Level 4 — Recommendation
The system recommends fixes.
Example:
Rollback service X
Restart exporter Y
Scale deployment Z
Drain node A
Check Ceph OSD B
Renew certificate C
Humans still approve the action.
Level 5 — Automated Remediation
The system performs low-risk actions automatically.
Example:
Restart crashed exporter
Re-run failed health check
Scale stateless service
Create incident ticket
Attach logs and traces
Notify owning team
High-risk actions still require approval.
8. Who Should Adopt AIOps?
AIOps is most valuable for teams running complex, distributed, high-volume, or business-critical systems.
Without observability engineering, AIOps becomes guesswork.
4. NOC Teams
Network Operations Centres can use AIOps to reduce noise and improve triage.
Common use cases:
deduplicating network alerts
identifying link degradation
correlating firewall, DNS, BGP, and load balancer events
detecting regional outages
routing incidents to the right team
AIOps should not be used to compensate for weak fundamentals.
10. What AIOps Requires Before It Works Well
AIOps needs a strong foundation.
Good Telemetry
You need reliable metrics, logs, traces, and events.
Bad data produces bad recommendations.
Good Service Ownership
The system must know:
who owns the service
who is on call
what the service depends on
what its SLO is
where the runbook is
Without ownership metadata, routing and remediation are weak.
Good Topology
AIOps needs to understand relationships.
Example:
frontend depends on checkout-api
checkout-api depends on postgres
postgres runs on node db-03
db-03 uses ceph-volume-17
ceph-volume-17 depends on osd-4
osd-4 runs on storage-node-2
Topology allows the system to understand blast radius.
Without change data, root cause analysis is incomplete.
Good Runbooks
AIOps automation depends on safe, tested actions.
Examples:
restart service
rollback deployment
clear failed job
rotate certificate
drain node
restart exporter
scale deployment
fail over service
If the runbooks are poor, automation becomes dangerous.
11. Risks and Anti-Patterns
AIOps can fail if implemented badly.
Risk 1: Treating AIOps as Magic
AIOps is not magic.
It cannot fix poor monitoring, poor architecture, missing logs, or unclear ownership.
Risk 2: Automating Too Soon
Do not let AI perform destructive actions before trust is established.
Dangerous actions include:
delete data
restart databases
modify firewall rules
change identity policies
drain production clusters
detach storage
scale expensive GPU workloads
Start with read-only analysis, then human-approved remediation.
Risk 3: Poor Explainability
AIOps must explain why it thinks something is wrong.
Bad:
Root cause: database.
Good:
Root cause is likely PostgreSQL primary saturation.
Evidence:
- connections reached max at 10:42
- API errors began at 10:43
- no deployment occurred
- CPU and disk IO increased on db-01
- similar incident occurred last month
Operations teams need evidence, not vague AI output.
The AI should support operations, not bypass them.
12. What Success Looks Like
A successful AIOps implementation should improve measurable outcomes.
You should track:
MTTA  - mean time to acknowledge
MTTR  - mean time to resolve
MTTD  - mean time to detect
alert volume
false positive rate
incident recurrence
toil hours
escalation rate
SLO compliance
change failure rate
automation success rate
The goal is not “we added AI.”
The goal is:
fewer noisy alerts
faster diagnosis
better root cause analysis
lower toil
higher service reliability
safer automation
more consistent operations
It is trying to solve the operational overload caused by modern distributed systems.
The teams that should adopt it first are:
SRE teams
platform engineering teams
observability teams
cloud infrastructure teams
NOC teams
DevOps teams
HPC/GPU platform teams
enterprises running critical 24/7 services
The best way to think about it is:
Observability tells you what happened. AIOps helps explain why it happened, what it affects, and what to do next.
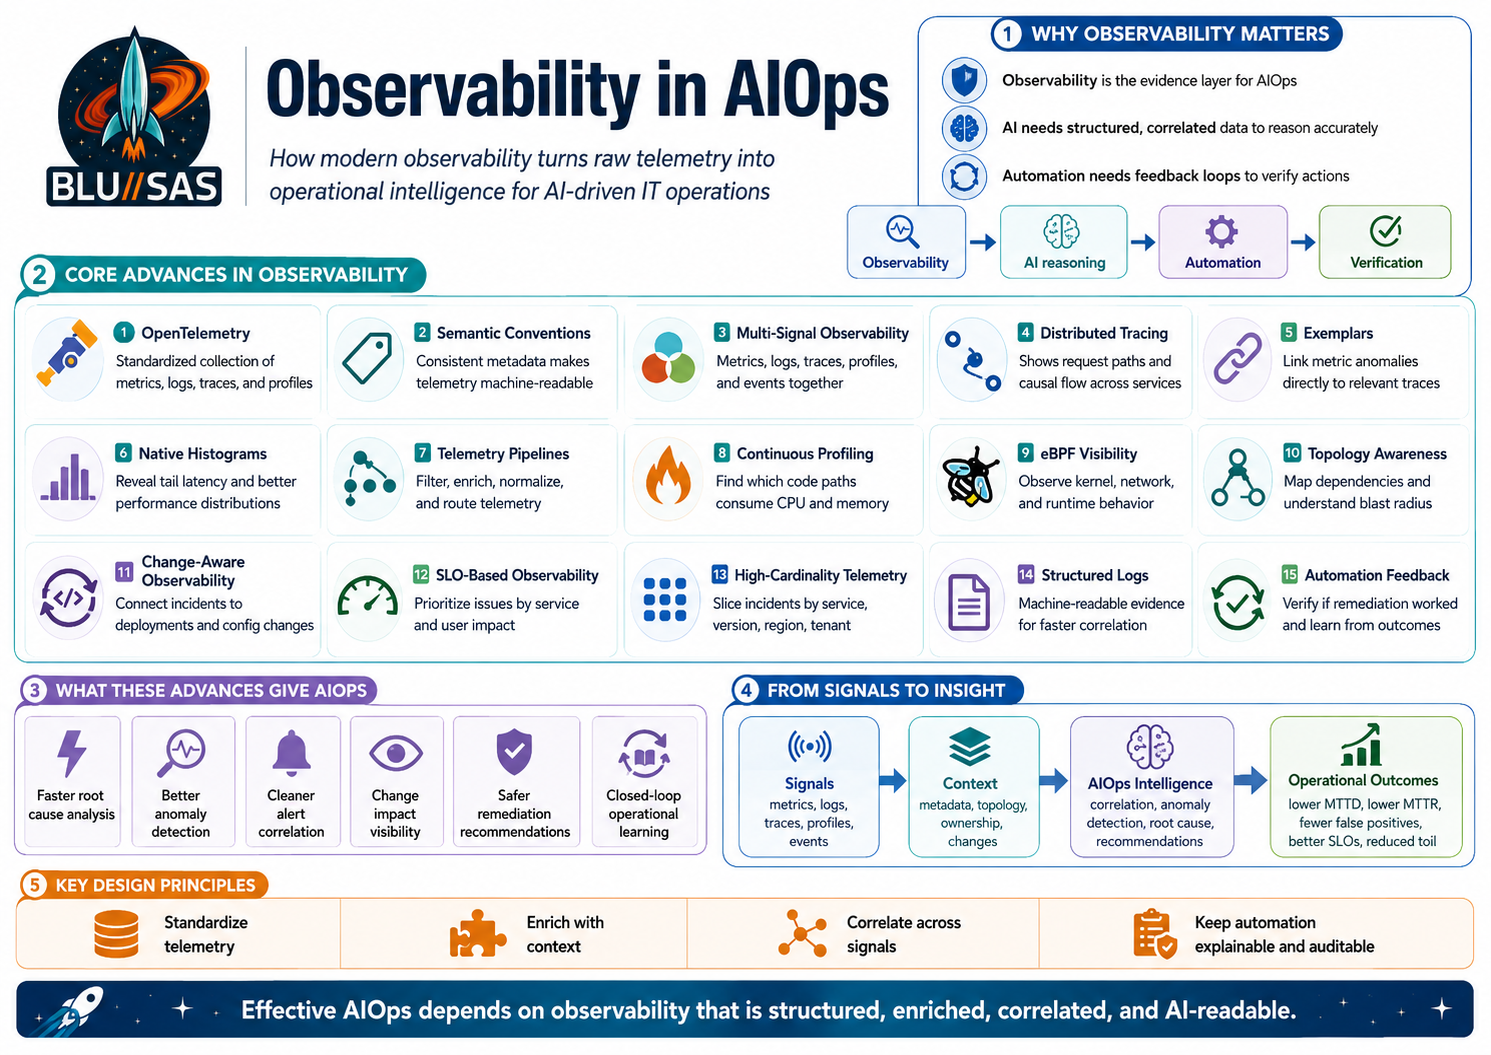
Observability Advances for Effective AIOps
Observability is arguably the most important technical component of AIOps.
AIOps is only as good as the operational data it can reason over. The AI layer does not magically understand your systems; it needs evidence. That evidence comes mainly from observability.
You can think of AIOps like this:
AIOps = AI reasoning + Observability data + Automation + ITSM/process + Governance
Or more practically:
Observability provides the evidence.
AI performs correlation and reasoning.
Automation executes safe actions.
ITSM/process manages incidents and ownership.
Governance keeps it controlled and auditable.
Why observability is central
Observability gives the AIOps system the raw material it needs:
Metrics  → What is slow, saturated, failing, or abnormal?
Logs     → What actually happened inside the system?
Traces   → Where did the request slow down or fail?
Events   → What changed in the platform?
Alerts   → What conditions crossed operational thresholds?
Topology → What depends on what?
Without this, AI has no reliable basis for diagnosis.
For example, if an AI agent is asked:
Why did gpu-test-01 fail to start?
It needs observability and operational signals from:
OpenStack state
Nova scheduler logs
Neutron events
Libvirt errors
Prometheus metrics
Loki logs
Slurm node state
GPU telemetry
Kubernetes events
Ceph health
Recent Ansible or config changes
The AI then correlates those signals into a root-cause explanation.
Describe the advances in Observability to make AIOps effectiveThought for 34s
Yes. The big advances in observability that make AIOps genuinely effective are not just “more dashboards.” They are about turning raw telemetry into structured, correlated, machine-readable operational evidence that AI can reason over.
The shift is:
Old monitoring:
Thresholds, dashboards, isolated alerts, manual diagnosis.

Modern observability for AIOps:
Correlated metrics, logs, traces, profiles, events, topology, ownership,
change history, and automation context.
AIOps needs observability to answer five operational questions:
What is happening?
Where is it happening?
Why is it happening?
What changed?
What should we do next?
1. Standardised Telemetry: OpenTelemetry
One of the biggest advances is OpenTelemetry.
Historically, every observability vendor or tool had its own agent, SDK, format, and metadata conventions. That made AIOps hard because the AI had to reason across inconsistent data.
OpenTelemetry helps by giving teams a vendor-neutral way to instrument, generate, collect, and export telemetry such as traces, metrics, and logs. Its Collector provides a common way to receive, process, and export telemetry, reducing the need to run many different agents.
For AIOps, this matters because AI performs better when telemetry has consistent structure.
That makes correlation, incident grouping, ownership mapping, and root-cause analysis much stronger.
3. Multi-Signal Observability
Traditional monitoring was heavily metrics-focused.
Modern observability combines multiple signals:
Metrics  → What is happening numerically?
Logs     → What discrete events occurred?
Traces   → How did a request move through the system?
Profiles → Which code consumed CPU, memory, or wall time?
Events   → What changed in the platform?
Kubernetes documentation still describes observability around metrics, logs, and traces as the main pillars for understanding cluster state, performance, and health. OpenTelemetry also describes observability signals as system outputs that describe application and platform activity.
For AIOps, this is fundamental.
A metric may say:
API latency is high.
A trace may say:
The latency is in the database query span.
A log may say:
Connection pool exhausted.
A deployment event may say:
New version deployed 5 minutes before the issue.
A profile may say:
CPU is being consumed by JSON serialisation in one function.
The AI can then produce a much better diagnosis than any single signal could provide.
4. Distributed Tracing and Context Propagation
Distributed tracing is one of the most important advances for AIOps.
In a monolith, a request might fail inside one process. In a microservices or cloud-native system, a single user request may cross:
Frontend
API gateway
Auth service
Checkout service
Payment service
Inventory service
Database
Message queue
External SaaS API
A trace connects those hops into one request journey.
For AIOps, tracing gives causal structure. It helps answer:
Where did the request slow down?
Which service returned the error?
Was the failure upstream or downstream?
Which tenant, region, node, or deployment was involved?
This makes root-cause analysis much more precise.
Without tracing, AIOps sees a pile of logs and metrics.
With tracing, it sees a connected execution path.
5. Exemplars: Linking Metrics to Traces
Another important advance is the ability to connect aggregate metrics to specific trace examples.
For example, a dashboard may show:
p99 latency = 2.4 seconds
But the engineer or AI needs to know:
Which actual request was slow?
What did that request do?
Which span caused the delay?
OpenTelemetry metrics support exemplars containing trace and span association fields, and Prometheus/OpenMetrics interoperability includes exemplar conversion rules.
For AIOps, exemplars are powerful because they bridge:
Metric anomaly → actual trace → logs from same request → root cause
That reduces guesswork.
6. Native Histograms and Better Latency Data
AIOps needs good latency distribution data, not just averages.
Average latency hides problems.
Example:
Average latency: 120 ms
That sounds fine, but the distribution may be:
95% of requests: 80 ms
4% of requests: 400 ms
1% of requests: 8 seconds
The 1% tail may be where real user pain exists.
Prometheus native histograms improve how latency and distribution data can be represented, and Prometheus native histograms with standard schemas can map to OpenTelemetry exponential histograms.
AI needs distribution-aware telemetry to avoid drawing conclusions from misleading averages.
7. Telemetry Pipelines and Data Processing
Another major advance is the rise of programmable telemetry pipelines.
The OpenTelemetry Collector can receive, process, and export telemetry, and its processors can transform, filter, and enrich telemetry as it flows through a pipeline. Grafana Alloy also provides pipelines for telemetry signals such as Prometheus and OpenTelemetry, with support for logs, metrics, traces, and profiles.
This is vital for AIOps because raw telemetry is often messy.
You need to:
drop noisy fields
redact secrets
normalise labels
add environment metadata
add ownership information
route critical data differently
sample high-volume traces
preserve error traces
enrich logs with Kubernetes metadata
convert vendor-specific formats
For AIOps, the telemetry pipeline becomes the data preparation layer.
Bad pipeline:
AI receives noisy, inconsistent, high-volume telemetry.
Good pipeline:
AI receives enriched, normalised, relevant operational evidence.
That is the difference between useful AIOps and expensive confusion.
8. Continuous Profiling
Continuous profiling is another big step forward.
Metrics tell you that CPU is high.
Profiles tell you which code path is consuming CPU.
OpenTelemetry describes profiles as answering which code is responsible for consuming resources, complementing logs, metrics, and traces. The OpenTelemetry Profiles specification describes profiles as an emerging fourth observability signal alongside logs, metrics, and traces. Grafana Pyroscope describes continuous profiling as a systematic method for collecting and analysing performance data from production systems.
For AIOps, profiling helps move from:
The service is slow.
to:
The service is slow because 63% of CPU time is spent in JSON serialisation
inside checkout-api after the latest release.
That is much closer to actionable root cause.
9. eBPF-Based Observability
eBPF has significantly improved infrastructure and network observability.
Cilium describes itself as an eBPF-based solution for networking, observability, and security, providing visibility into workload connectivity. Hubble, built on Cilium, uses eBPF to provide dynamic visibility with detailed insight where needed.
For AIOps, eBPF is valuable because it can observe behaviour at the kernel and network layer without requiring every application to be perfectly instrumented.
It can help answer:
Which pod connected to which service?
Where are packets being dropped?
Is DNS failing?
Is the issue L3, L4, or L7?
Is network policy blocking traffic?
Is the service reachable?
Which process opened this connection?
This is especially important for Kubernetes, OpenStack, service mesh, GPU clusters, and distributed storage platforms.
For your type of environment, eBPF observability is particularly relevant because many failures happen below the application layer:
Neutron networking
Kubernetes CNI
DNS
load balancing
firewalling
pod-to-pod connectivity
GPU node networking
Ceph traffic
Slurm controller-to-worker communication
10. Topology-Aware Observability
AIOps cannot do strong root-cause analysis if it does not understand relationships.
It needs topology.
Example:
frontend
  depends on checkout-api
    depends on postgres
      runs on k8s-worker-03
        uses ceph-volume-17
          backed by osd-4
            runs on storage-node-02
Another advance is the move from infrastructure-centric alerts to service-centric SLOs.
Old alerting:
CPU > 90%
Disk > 80%
Pod restarted
Node memory high
Better alerting:
Checkout API availability below SLO
Payment latency budget burning too fast
Login error rate above user-impact threshold
For AIOps, SLOs provide priority.
Not every anomaly matters equally.
A CPU spike on a batch node may be fine.
A small increase in payment failures may be urgent.
SLO-based observability helps AIOps rank incidents by user impact rather than raw technical noise.
13. High-Cardinality and Dimensional Telemetry
Modern systems need dimensional analysis.
You need to slice by:
service
namespace
cluster
region
tenant
customer
version
endpoint
pod
node
GPU model
availability zone
database shard
queue
deployment
Prometheus uses a dimensional data model where time series are identified by a metric name and key-value labels, and PromQL allows teams to query, correlate, and transform time-series data.
For AIOps, dimensions are essential.
Instead of:
API latency is high.
you want:
API latency is high only for:
service=checkout-api
version=v2.4.1
region=eu-west
tenant=customer-a
endpoint=/payment/confirm
That turns a vague incident into a narrowed investigation.
The “verify” and “learn” stages depend heavily on observability.
16. AI-Readable Operational Context
The latest practical advance is making observability data usable by AI agents.
That means exposing operational systems through APIs, query layers, or protocols such as MCP-style tool access.
The AI needs controlled access to:
metrics queries
log search
trace lookup
profile analysis
Kubernetes state
OpenStack state
Slurm queue state
Ceph health
GitLab deployments
Ansible runbooks
incident history
service ownership
This turns observability from something humans look at into something AI can query and reason over.
For example:
User asks:
"Why did gpu-test-01 fail to start?"

AI queries:
OpenStack state
Nova logs
Neutron events
Prometheus GPU metrics
Slurm state
Kubernetes GPU operator status
Ceph health
recent config changes

AI replies:
"Nova failed to schedule the VM because the requested PCI alias is not defined.
Neutron and storage are healthy. The failure is isolated to Nova PCI configuration."
That is observability becoming operational intelligence.
How These Advances Make AIOps Effective
The relationship is simple:
Observability advance
What it gives AIOps
OpenTelemetry
Standard telemetry collection
Semantic conventions
Consistent metadata
Metrics
Quantitative system health
Logs
Event-level explanation
Traces
Request-level causality
Profiles
Code-level resource attribution
Exemplars
Link from metric anomaly to trace
eBPF
Kernel/network visibility
Topology
Dependency and blast-radius context
Change events
“What changed?” analysis
SLOs
Business/user-impact priority
Telemetry pipelines
Clean, enriched, governed data
Structured logs
Machine-readable evidence
Automation feedback
Safe remediation verification
For Your OpenStack / Kubernetes / Slurm / GPU Homelab
For your environment, the observability stack that would make AIOps effective should include:
Metrics: Prometheus / Mimir
Logs: Loki
Traces: Tempo
Profiles: Pyroscope
Collection and pipelines: OpenTelemetry Collector or Grafana Alloy
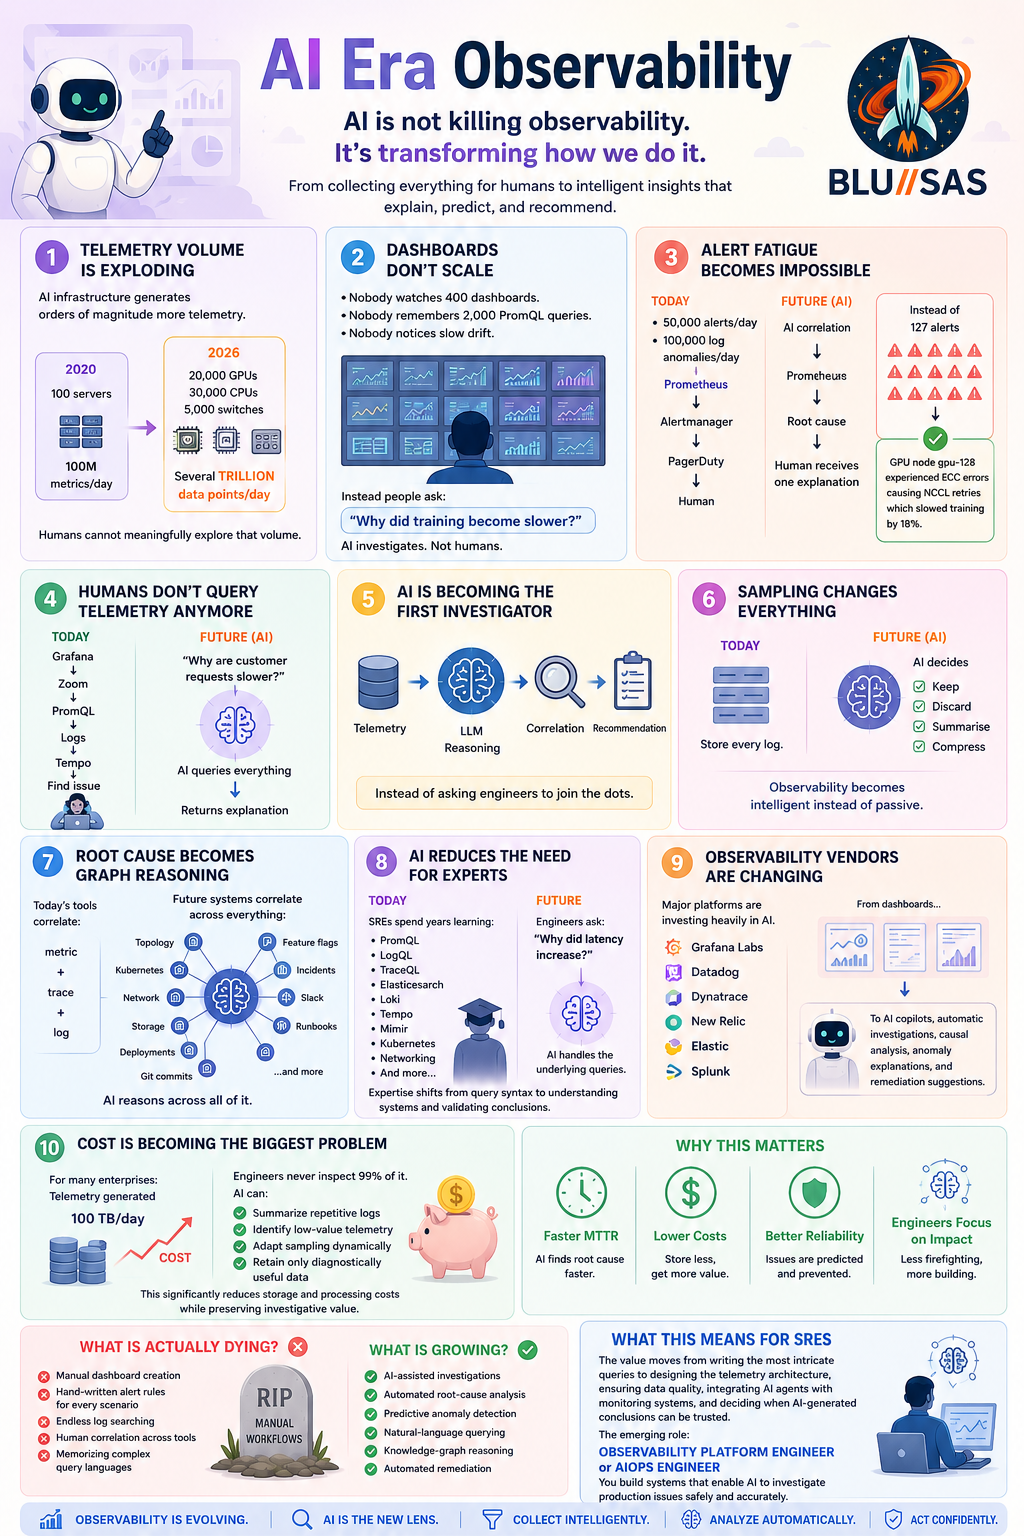
AI is not killing observability as a discipline, but it is fundamentally changing how observability is done. The traditional model of “collect everything, store everything, and let humans investigate later” is becoming increasingly impractical in AI-driven infrastructures.
1. Telemetry volume is exploding
Modern systems produce far more telemetry than they did five years ago.
An AI factory may contain:
Tens of thousands of GPUs
Hundreds of thousands of CPU cores
High-speed fabrics (RoCE, InfiniBand)
Kubernetes
Distributed storage (Ceph, Lustre, GPFS)
AI inference services
LLM gateways
Each component exports metrics, logs, traces and events.
For example:
2020

100 servers
↓
100 million metrics/day

2026

20,000 GPUs
30,000 CPUs
5,000 switches

↓

Several trillion data points/day
Humans cannot meaningfully explore that volume.
2. Dashboards don’t scale
Traditional observability assumes people sit looking at Grafana dashboards.
Reality:
nobody watches 400 dashboards
nobody remembers 2,000 PromQL queries
nobody notices slow drift
Instead people increasingly ask:
“Why did training become slower?”
AI investigates.
Not humans.
3. Alert fatigue becomes impossible
Large organisations often generate
50,000 alerts/day
100,000 log anomalies/day
Historically:
Prometheus
↓
Alertmanager
↓
PagerDuty
↓
Human
Future:
Prometheus
↓
AI correlation
↓
Root cause
↓
Human receives one explanation
Instead of:
127 alerts
Engineer receives
GPU node gpu-128 experienced ECC errors causing NCCL retries which slowed training by 18%.
Observability becomes intelligent instead of passive.
7. Root cause becomes graph reasoning
Today’s tools often correlate:
metric
+
trace
+
log
Future systems correlate:
topology
Kubernetes
network
storage
deployments
Git commits
feature flags
incidents
Slack discussions
runbooks
into one knowledge graph.
AI reasons across all of it.
8. AI reduces the need for experts
Today an SRE may spend years learning:
PromQL
LogQL
TraceQL
Elasticsearch
Loki
Tempo
Mimir
Kubernetes
networking
Future engineers may simply ask:
Why did latency increase?
The AI handles the underlying queries.
Expertise shifts from query syntax to validating conclusions and understanding system design.
9. Observability vendors are changing
Every major platform is investing heavily in AI assistants.
Examples include:
Grafana Labs
Datadog
Dynatrace
New Relic
Elastic
Splunk
They’re moving from:
dashboards
to:
AI copilots
automatic investigations
causal analysis
anomaly explanations
remediation suggestions
10. Cost is becoming the biggest problem
Storage costs are growing faster than engineering budgets.
For many enterprises:
Telemetry generated

100 TB/day
Engineers never inspect 99% of it.
AI can:
summarize repetitive logs
identify low-value telemetry
adapt sampling dynamically
retain only diagnostically useful data
This can significantly reduce storage and processing costs while preserving investigative value.
What is actually dying?
It is not observability itself, but the manual workflows around it.
Declining:
Manual dashboard creation
Hand-written alert rules for every scenario
Endless log searching
Human correlation across tools
Memorizing complex query languages
Growing:
AI-assisted investigations
Automated root-cause analysis
Predictive anomaly detection
Natural-language querying
Knowledge-graph reasoning
Automated remediation
What this means for SREs
For someone with your background in observability platforms, this shift is an opportunity rather than a threat. The value moves away from being the person who can write the most intricate PromQL query and toward designing the telemetry architecture, ensuring data quality, integrating AI agents with monitoring systems, and deciding when AI-generated conclusions can be trusted.
The emerging role is less “dashboard builder” and more Observability Platform Engineer or AI Operations (AIOps) Engineer—someone who builds systems that enable AI to investigate production issues safely and accurately. That combination of platform engineering, distributed systems, and AI integration is likely to be in increasing demand over the next decade.
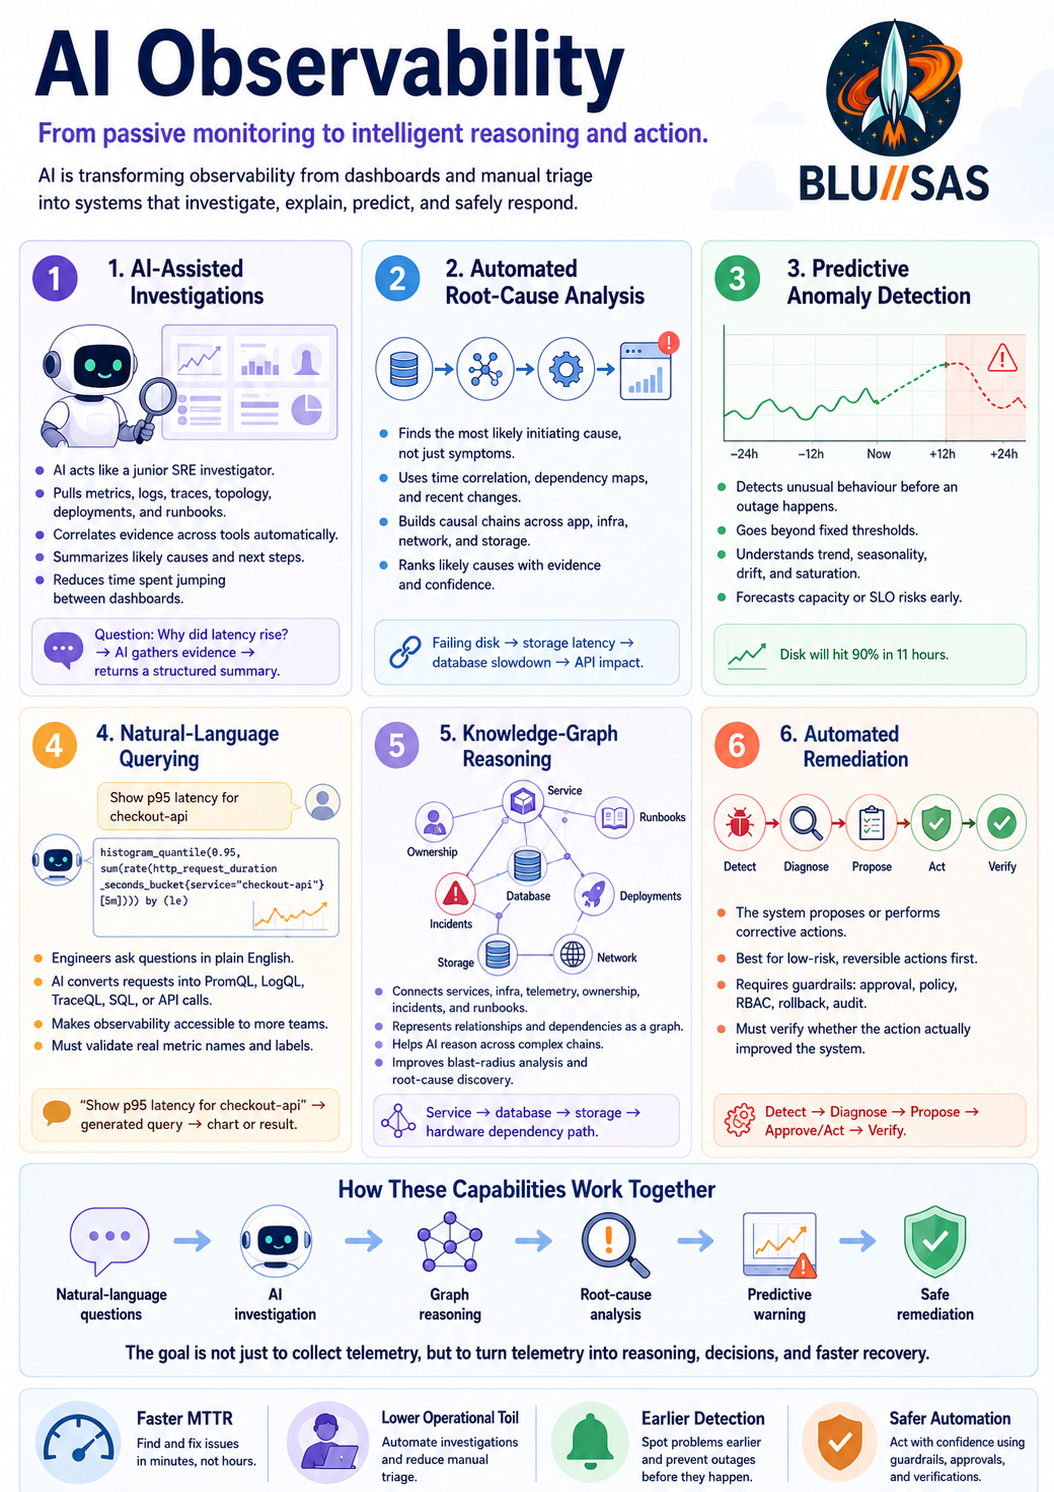
What is AI Observability?
AI-era observability is moving from human-driven inspection to machine-assisted reasoning over telemetry, topology, history and operational knowledge.
The key shift is this:
Old observability:

Metrics + logs + traces
        ↓
Dashboards and alerts
        ↓
Human investigates
        ↓
Human decides
        ↓
Human fixes


AI-era observability:

Metrics + logs + traces + topology + deployments + runbooks + incidents
        ↓
AI correlation and reasoning layer
        ↓
Probable cause, blast radius, next action
        ↓
Human approval or automated remediation
Below is a detailed breakdown of the six areas.
1. AI-assisted investigations
What it means
AI-assisted investigation is where an AI system acts like a junior SRE investigator sitting beside you.
It does not necessarily fix the issue automatically. Its main job is to reduce the time spent asking basic investigative questions.
The AI then queries multiple systems and returns a structured investigation.
What it does
A good AI investigation assistant can:
Detect the relevant service, namespace, cluster or tenant.
Pull related metrics.
Search logs around the incident window.
Inspect traces for slow spans.
Compare current behaviour against baseline behaviour.
Check recent deployments.
Check Kubernetes events.
Check node, pod, container and network health.
Retrieve relevant runbooks.
Summarise likely causes.
Recommend next diagnostic steps.
Example
You ask:
Why is the inference API slower?
The AI investigates:
1. Latency increased at 10:17.
2. p95 rose from 420 ms to 1.8 s.
3. Error rate did not increase.
4. GPU utilisation remained high.
5. Queue depth increased.
6. New model version was deployed at 10:12.
7. Logs show repeated batching timeout warnings.
8. Traces show delay before GPU execution, not during execution.
Result:
Likely issue:
The model service is queueing requests before GPU execution.

Probable cause:
The new batching configuration increased max_batch_wait_ms from 20 ms to 250 ms.

Recommended action:
Rollback batching config or reduce batch wait threshold.
That is much faster than manually checking ten dashboards.
What data it needs
AI-assisted investigation works best when it has access to:
Context: - Deployment history - Git commits - Feature flags - Config changes - Runbooks - Incident history - Service ownership
Without context, AI just summarises telemetry. With context, it can investigate.
SRE value
For SREs, this means less time doing mechanical investigation and more time validating the diagnosis.
The future SRE skill is not just:
Can I write PromQL?
It becomes:
Can I design telemetry so AI can reason correctly?
Can I validate the AI's conclusion?
Can I prevent unsafe remediation?
Can I encode good operational knowledge into the platform?
2. Automated root-cause analysis
What it means
Automated root-cause analysis, or automated RCA, is the process of identifying the most likely initiating cause of a production issue without relying entirely on manual human correlation.
It tries to answer:
What actually started the incident?
Not merely:
What symptoms are currently visible?
This distinction matters.
Symptom versus root cause
Example incident:
Customer latency is high.
API pods are slow.
Database queries are slow.
Storage latency is high.
Ceph OSDs are rebalancing.
One storage node has a failing disk.
The symptoms are:
High API latency
Slow database responses
Increased request duration
More timeout warnings
The probable root cause is:
A failing disk caused Ceph recovery/rebalancing,
which increased storage latency,
which slowed the database,
which slowed the API.
Automated RCA attempts to build that causal chain.
How automated RCA works
There are several techniques.
1. Temporal correlation
The system checks what changed first.
10:01 disk errors begin
10:03 Ceph recovery starts
10:05 storage latency rises
10:07 database latency rises
10:09 API latency rises
10:10 customer alerts fire
The earliest credible abnormal event is often close to the root cause.
Many incidents are change-induced. A useful RCA system always asks:
What changed recently?
4. Statistical anomaly ranking
The system ranks abnormal signals.
For example:
Signal                         Abnormality score
GPU ECC errors                 0.98
NCCL retry count               0.94
Training step duration         0.91
CPU usage                      0.22
Memory usage                   0.18
The AI focuses on the strongest abnormal signals.
5. Causal graph reasoning
This is more advanced.
Instead of treating metrics as isolated time series, the system builds a causal model:
Bad disk
  → Ceph recovery
  → Storage latency
  → Database latency
  → API latency
  → Customer impact
This is much closer to how an experienced SRE thinks.
Example automated RCA output
Incident: Checkout latency p95 increased from 300 ms to 2.4 s.
Likely root cause: PostgreSQL read latency increased due to degraded Ceph RBD volume performance.
Evidence: - API latency increased at 13:42. - PostgreSQL read latency increased at 13:39. - Ceph pool latency increased at 13:36. - OSD 12 reported slow ops and disk errors at 13:34. - No relevant application deployment occurred in the previous hour.
Recommended action: - Mark OSD 12 out if disk errors continue. - Move affected workload if possible. - Check Ceph recovery/backfill limits. - Consider temporarily scaling API timeout thresholds.
What makes automated RCA hard
Automated RCA is difficult because distributed systems are messy.
Common problems:
Correlation is not causation.
Multiple things can break at once.
Telemetry may be missing.
Logs may be noisy.
Clocks may not be perfectly synchronised.
Service dependency maps may be stale.
The root cause may be outside the monitored system.
This is why good automated RCA usually gives:
Probable cause
Confidence level
Supporting evidence
Contradicting evidence
Recommended next checks
It should not pretend to be certain when it is not.
3. Predictive anomaly detection
What it means
Predictive anomaly detection tries to detect abnormal behaviour before it becomes a major incident.
Traditional alerting says:
Alert when disk usage > 90%.
Predictive alerting says:
Disk usage is growing at a rate that will hit 90% in 11 hours.
A disk at 60% may be dangerous if it is growing rapidly.
Predictive anomaly detection
Predictive systems look at behaviour over time:
Normal pattern:
- CPU rises during business hours
- drops overnight
- spikes during batch processing

Abnormal pattern:
- CPU rises at midnight
- no scheduled job exists
- memory grows continuously
- request rate is normal
The system detects that the pattern is unusual, even if no hard threshold has been crossed.
Types of predictive anomalies
1. Trend-based prediction
Useful for capacity planning.
Disk usage will reach 90% in 3 days.
Mimir object storage will exceed budget in 12 days.
Kafka partition disk will fill in 9 hours.
Ceph pool will hit near-full ratio this weekend.
2. Seasonality-aware anomaly detection
Useful for normal daily/weekly cycles.
Example:
CPU at 80% at 10:00 Monday may be normal.
CPU at 80% at 03:00 Sunday may be abnormal.
The system learns expected patterns.
3. Multivariate anomaly detection
Looks at several signals together.
For example:
Request rate: normal
Error rate: normal
Latency: high
CPU: normal
Database latency: high
Network retransmits: high
Individually, some metrics may not trigger alerts. Together, they reveal an abnormal condition.
4. Behavioural drift detection
Useful in AI and ML platforms.
Example:
Training jobs are completing successfully,
but average step time has increased by 12% over two weeks.
No incident has occurred yet, but performance is drifting.
5. Saturation prediction
Very useful for SRE.
GPU memory saturation likely within 40 minutes.
Kubernetes node memory pressure likely in 2 hours.
Ceph recovery will saturate backend network.
Kafka consumer lag will exceed SLO in 25 minutes.
Natural-language querying allows engineers to ask operational questions in plain English instead of writing PromQL, LogQL, TraceQL, SQL or Elasticsearch queries manually.
Example:
Show me p95 latency for checkout-api over the last 6 hours,
split by Kubernetes namespace.
The AI converts that into the right query.
Traditional workflow
You need to know the query language:
histogram_quantile(
  0.95,
  sum by (le, namespace) (
    rate(http_request_duration_seconds_bucket{
      service="checkout-api"
    }[5m])
  )
)
With natural-language querying:
What is checkout-api p95 latency by namespace for the last 6 hours?
Without that, the AI may generate syntactically valid but operationally useless queries.
Risk: hallucinated queries
Natural-language querying can be dangerous if it invents metric names.
Bad output:
rate(checkout_latency_seconds[5m])
But that metric may not exist.
Better behaviour:
I could not find a metric named checkout_latency_seconds.
I found http_request_duration_seconds_bucket with service="checkout-api".
Using that instead.
The AI should verify queries against the actual telemetry backend.
SRE impact
SREs will still need to understand PromQL, LogQL and traces, but less time will be spent manually composing queries.
The valuable skill becomes designing the semantic layer:
Good metric names
Useful labels
Consistent service metadata
Accurate ownership data
Clear runbooks
Well-documented SLOs
5. Knowledge-graph reasoning
What it means
Knowledge-graph reasoning connects operational facts into a graph so AI can reason over relationships.
A flat dashboard cannot represent that well. A graph can.
6. Automated remediation
What it means
Automated remediation is when the system not only detects and diagnoses an issue, but also takes corrective action.
This is the most powerful and most dangerous part of AI-era observability.
It moves from:
Observe → Alert → Human fixes
to:
Observe → Diagnose → Decide → Act → Verify
Simple automated remediation
Low-risk examples:
Restart a failed pod.
Scale a deployment from 3 to 5 replicas.
Clear a stuck job.
Rotate a saturated log file.
Drain a bad Kubernetes node.
Open an incident ticket.
Create a Slack/PagerDuty summary.
Rollback a known-bad deployment.
Increase queue consumers.
Advanced automated remediation
Higher-risk examples:
Move workloads away from degraded storage.
Change Ceph recovery/backfill settings.
Disable a feature flag.
Rebalance Kafka partitions.
Quarantine a GPU node.
Remove a bad node from a load balancer.
Apply a network policy change.
Trigger disaster recovery failover.
Patch a vulnerable service.
These require stronger guardrails.
The remediation loop
A safe remediation system should work like this:
1. Detect
   Something abnormal happened.

2. Diagnose
   Determine probable cause and confidence.

3. Propose
   Generate a remediation plan.

4. Check policy
   Is this action allowed?
   Is the blast radius acceptable?
   Is approval required?

5. Act
   Execute the change.

6. Verify
   Did the metric improve?
   Did errors reduce?
   Did customer impact stop?

7. Roll back
   If not improved, revert or escalate.

8. Learn
   Record the incident and outcome.
Example
Issue:
checkout-api error rate increased after deployment.
AI investigation:
New version deployed at 09:03.
Errors began at 09:05.
Only pods running version v2.7.4 are affected.
Previous version v2.7.3 had no errors.
Remediation proposal:
Rollback checkout-api from v2.7.4 to v2.7.3.
Policy check:
Allowed because:
- service has rollback automation
- error rate exceeds SLO threshold
- last known-good version exists
- no database migration detected
Action:
kubectl rollout undo deployment/checkout-api
Verification:
Error rate returned to baseline after 4 minutes.
p95 latency returned to normal.
Incident summary created.
Guardrails are essential
Automated remediation must not be a reckless agent with production write access.
Good guardrails include:
Read-only by default
Approval required for high-risk actions
Change windows
Blast-radius limits
Dry-run mode
Policy-as-code
RBAC
Audit logs
Rollback plans
Rate limits
Canary execution
Human confirmation for destructive actions
For example:
Allowed automatically:
- restart one unhealthy pod
- scale a stateless service within limits
- create an incident ticket

Requires approval:
- drain production node
- rollback payment service
- modify firewall/network policy
- change Ceph recovery settings
- fail over database
How these six areas fit together
They are not separate ideas. They form a pipeline.
I would not start with fully automated remediation. That is too risky.
The sensible maturity path is:
Stage 1: AI-assisted read-only investigation
Build a tool that can answer:
What changed?
What alerts fired?
What services are affected?
What logs are unusual?
What traces are slow?
What runbook applies?
No write actions.
Stage 2: Natural-language query assistant
Allow engineers to ask:
Show me p95 latency by service.
Find logs for this incident window.
Show me failed pods after the deployment.
Compare today’s error rate with yesterday.
The assistant should show the generated query so the engineer can verify it.
Stage 3: Incident summariser
Generate structured summaries:
Incident:
Impact:
Start time:
Affected services:
Probable cause:
Evidence:
Actions taken:
Current status:
Recommended next steps:
This alone saves huge operational time.
Stage 4: RCA recommendation engine
Add correlation with:
Deployments
Kubernetes events
Node health
Storage health
Network telemetry
Recent config changes
Output probable root cause with confidence.
Stage 5: Predictive alerting
Start with safer predictions:
Disk will fill.
Object storage usage will exceed budget.
Kafka lag will breach SLO.
Ceph pool will hit near-full.
Certificate will expire.
GPU nodes are showing increasing ECC errors.
Stage 6: Human-approved remediation
The AI proposes actions, but humans approve.
Example:
Recommended action:
Drain node gpu-17 and reschedule workloads.

Reason:
GPU ECC errors increased and training retries are affecting jobs.

Approval required:
Yes.
Stage 7: Limited automatic remediation
Only allow automation for narrow, reversible, low-risk actions.
Restart crashed pod
Scale stateless deployment
Reopen failed consumer
Create incident ticket
Disable noisy alert temporarily with expiry
Main risks
AI observability can go wrong if the system has poor telemetry or too much authority.
1. Bad telemetry in, bad reasoning out
If labels are inconsistent, traces are incomplete, or logs are unstructured, AI conclusions will be weak.
2. Hallucinated root cause
The AI may sound confident while being wrong.
Always require:
Evidence
Confidence
Alternative theories
Query links
Raw data references
3. Unsafe remediation
A bad automated action can make an incident worse.
Example:
AI sees high memory.
AI restarts all pods.
All pods restart at once.
Outage gets worse.
That is why blast-radius control matters.
4. Hidden cost explosion
AI investigation can generate expensive backend queries.
A poorly controlled AI assistant may run huge queries across logs, traces and metrics.
Read-only access for most users
Sensitive log masking
No secret exposure
Audit trail
Approval for write actions
Tenant isolation
The big picture
These six capabilities are the future of observability:
Capability
Main purpose
Human role
AI-assisted investigations
Speed up incident analysis
Validate findings
Automated RCA
Identify probable cause
Judge evidence
Predictive anomaly detection
Prevent incidents earlier
Tune models and thresholds
Natural-language querying
Make telemetry easier to access
Verify generated queries
Knowledge-graph reasoning
Understand system relationships
Maintain accurate topology
Automated remediation
Fix or mitigate issues
Define guardrails and approve risk
The core change is this:
Observability is no longer just about collecting telemetry.

It is becoming a reasoning system over telemetry.
For SREs, the opportunity is to become the person who builds and governs that reasoning system: telemetry quality, context, automation safety, incident workflows, and trust boundaries.
Commercial AI Observability
Commercial companies are building AI into observability in two directions:
AI for observability — using AI to investigate, correlate, explain, predict and remediate production issues.
Observability for AI — monitoring LLMs, agents, RAG pipelines, vector databases, model quality, hallucinations, token cost, latency, drift and safety.
So the product shift is not just “add a chatbot to dashboards.” The bigger move is toward an AI operations layer that sits above metrics, logs, traces, events, topology and runbooks.
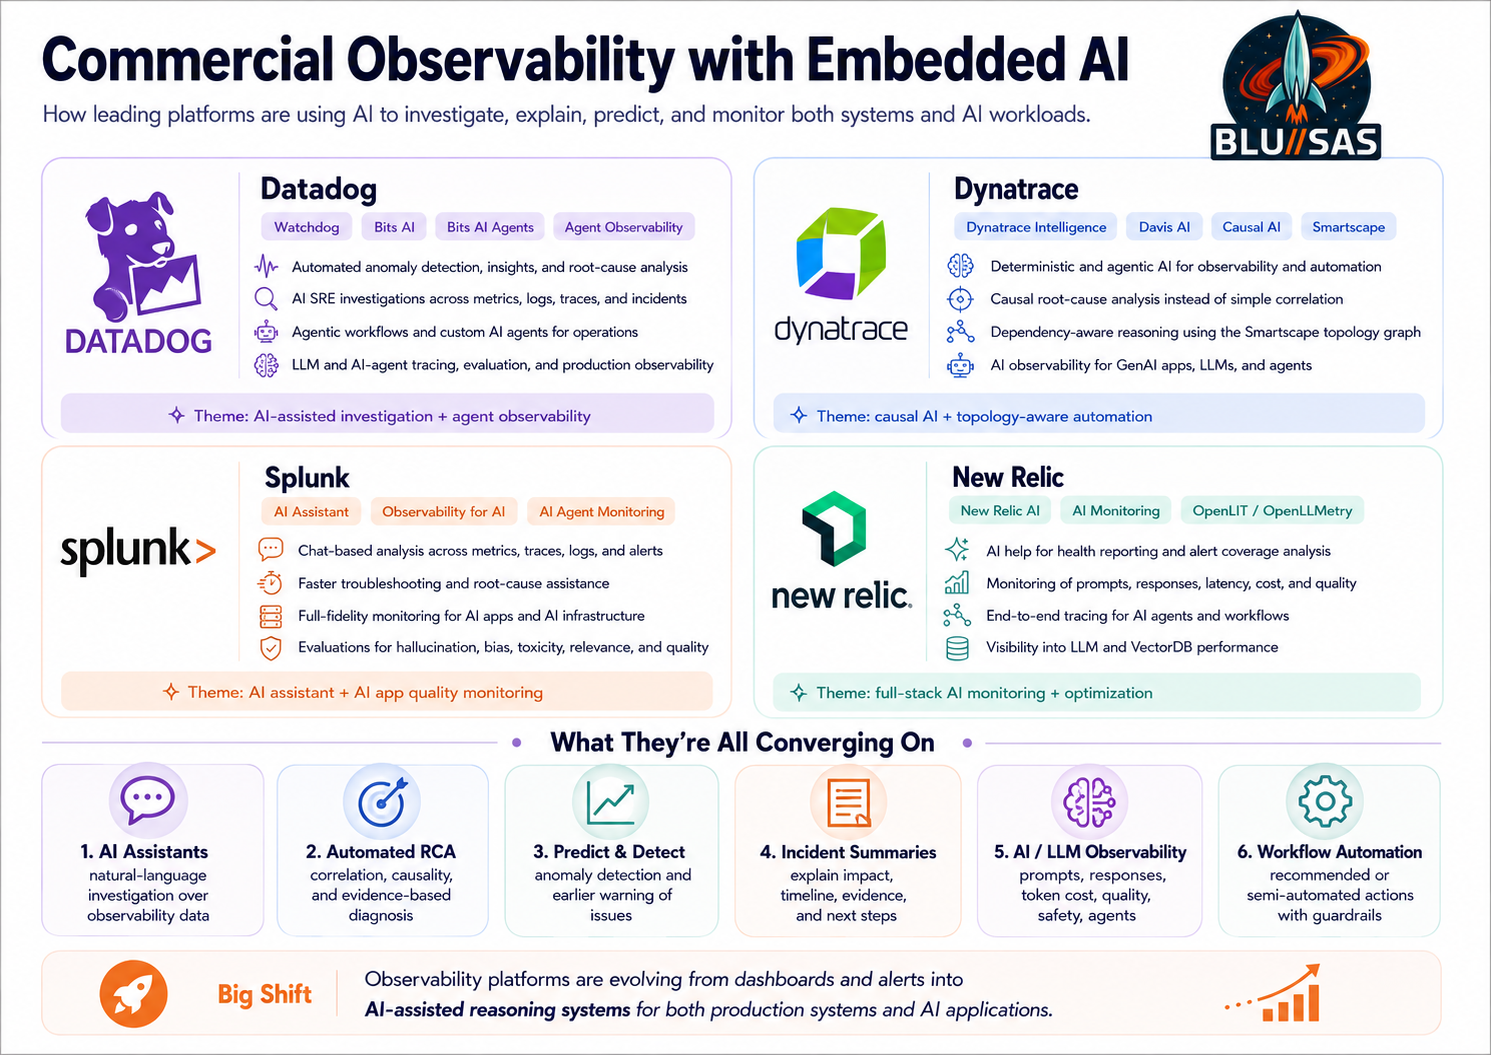
Datadog is building AI into its platform around Bits AI, Watchdog, and LLM/Agent Observability.
Datadog’s Watchdog is its AI engine for automated alerts, insights and root-cause analysis across Datadog telemetry. It continuously monitors infrastructure and surfaces important signals to help teams detect, troubleshoot and resolve issues.
Datadog’s Bits AI SRE is positioned as an always-on AI SRE agent that helps handle troubleshooting and alerts, with Datadog describing it as able to pinpoint root causes faster by using Datadog’s incident and telemetry context.
Datadog is also pushing Bits AI Agents and Agent Builder, where the platform can build custom AI agents that investigate issues, make decisions and take action using Datadog and third-party data, with prebuilt actions across cloud, security, CI/CD and collaboration tooling.
For the second direction, Datadog has Agent Observability / LLM Observability, aimed at tracing, evaluating and improving LLM-powered applications and AI agents. Datadog says each LLM application request can be represented as a trace, allowing teams to investigate root cause, operational performance, quality, privacy and safety.
Datadog is also doing deeper model work: its Toto time-series foundation model is specifically designed for observability time-series forecasting and was trained partly on Datadog observability data.
2. Dynatrace
Dynatrace has probably been the most explicit about putting causal AI at the centre of observability.
Its AI engine is Davis AI / Dynatrace Intelligence. Dynatrace describes its AI approach as combining predictive AI, causal AI and generative AI over unified observability and security data to automate workflows.
Dynatrace’s key differentiator is that it does not want the AI to merely correlate metrics. It wants the platform to understand causality: what caused what, what depends on what, and what failure actually triggered the incident. Dynatrace describes causal AI as using causal and deterministic techniques to determine underlying causes and effects rather than just relying on correlation.
Dynatrace also presents Dynatrace Intelligence as combining deterministic insights with agentic action for prevention, remediation and optimisation at scale.
For AI workloads, Dynatrace has AI and LLM Observability for monitoring, optimising and securing generative AI apps, LLMs and agentic workflows, with emphasis on performance, explainability and compliance.
In SRE terms, Dynatrace is building:
Dynatrace AI direction:

Davis AI / Dynatrace Intelligence
  → anomaly detection
  → causal root-cause analysis
  → topology-aware problem detection
  → predictive risk detection
  → generative explanations
  → workflow automation

Causal AI
  → dependency-aware analysis
  → fault-tree-style reasoning
  → root cause, not just symptom correlation

AI and LLM Observability
  → GenAI app monitoring
  → LLM and agentic workflow visibility
  → explainability
  → compliance-oriented monitoring
The important point: Dynatrace is trying to make observability less like “search through telemetry” and more like automated dependency-aware diagnosis.
3. Splunk
Splunk is building AI into observability through Splunk AI Assistant in Observability Cloud, broader AI Observability, and AI/agent monitoring.
Splunk’s AI Assistant in Observability Cloud uses observability data from metrics, traces, logs and alerts through a chat interface inside Splunk Observability Cloud.
Splunk says the AI Assistant can analyze data across APM, Infrastructure Monitoring, Database Monitoring, RUM and log analytics to help with root-cause analysis.
Splunk is also building “observability for AI” capabilities. Its Splunk Observability for AI is described as full-fidelity monitoring and troubleshooting across AI applications and the AI infrastructure components used to build them.
Splunk’s AI Agent Monitoring aims to correlate degraded AI agent/model performance and track operational metrics such as latency and errors alongside quality/security metrics such as hallucinations, bias, drift, accuracy, cost and token usage.
Splunk’s AI Observability positioning is broader: observe and optimise performance, quality, cost and security across agents, LLMs, vector databases and infrastructure.
AI Observability → AI application monitoring → AI infrastructure monitoring → agent performance tracking → LLM quality and safety monitoring
AI Agent Monitoring → latency and errors → hallucination tracking → bias/drift/accuracy → token and cost visibility → model and agent reliability
Splunk’s direction is very aligned with its historical strength: search, correlation and operational analytics, now wrapped in AI-assisted investigation and AI workload monitoring.
4. New Relic
New Relic is building AI into its platform through New Relic AI, AI-powered observability features, and AI Monitoring / LLM observability.
New Relic says New Relic AI can help instrument systems, generate system health reports and identify alert coverage gaps for full-stack observability.
New Relic has also positioned its platform as AI-powered observability that correlates telemetry across the stack to isolate root cause and reduce operational toil.
For LLM applications, New Relic AI monitoring captures telemetry from AI-powered apps through APM agents and collects data from external LLMs and vector stores.
New Relic’s AI monitoring focuses on troubleshooting, comparing and optimising LLM prompts and responses for performance, cost and quality issues such as hallucination, bias and toxicity.
It also supports LLM observability through OpenLIT integration, which automatically generates traces and metrics for LLM and VectorDB performance and cost analysis.
In SRE terms, New Relic is building:
New Relic AI direction:
New Relic AI → AI assistant for DevOps → system health reports → alert coverage analysis → instrumentation help
AI Monitoring / LLM Observability → prompt/response analysis → LLM latency and error tracking → cost analysis → hallucination, bias and toxicity signals → VectorDB visibility
New Relic’s direction is about making its “all-in-one observability” platform more assistant-driven and making AI workloads first-class observable systems.
What they are all converging on
All four vendors are converging on the same broad architecture:
Finds likely root cause using telemetry and topology
Predictive anomaly detection
Spots problems before thresholds are breached
Natural-language querying
Converts plain English into PromQL, LogQL, SQL, trace/log queries
Incident summarisation
Explains impact, timeline, evidence and next steps
Runbook automation
Recommends or triggers operational workflows
AI workload monitoring
Monitors LLMs, agents, prompts, responses, cost and quality
Governance/safety
Tracks hallucination, toxicity, bias, privacy and compliance risks
Cost optimisation
Reduces telemetry waste and tracks LLM/token spend
The strategic reason they are doing this
The observability market is under pressure from three directions.
First, telemetry volumes are exploding. Kubernetes, microservices, edge, GPU clusters, AI workloads and distributed storage produce far more telemetry than humans can manually inspect.
Second, SRE teams are overloaded. Vendors are trying to sell “lower MTTR” and “less operational toil” by making the platform do more triage and correlation automatically.
Third, AI applications create new observability requirements. Traditional APM can tell you latency and error rate, but AI systems also need visibility into prompts, responses, hallucinations, drift, token usage, model quality, RAG retrieval quality, vector database behaviour and agent decisions.
So vendors are not just adding AI because it is fashionable. They are defending and expanding their core observability business.
What this means for an SRE / Observability Platform Engineer
The skill shift is significant.
Old value:
Build dashboards.
Write alert rules.
Know PromQL and LogQL.
Search logs manually.
Correlate incidents by experience.
New value:
Design telemetry that AI can reason over.
Standardise labels and service metadata.
Maintain accurate topology and ownership maps.
Connect observability to deployment and incident data.
Create safe remediation workflows.
Validate AI-generated RCA.
Control cost, access and blast radius.
The winners will not simply be the engineers who know the most dashboards. The winners will be the engineers who can build a trusted operational intelligence layer over metrics, logs, traces, topology and automation.
AI Strategies of New Observability Products
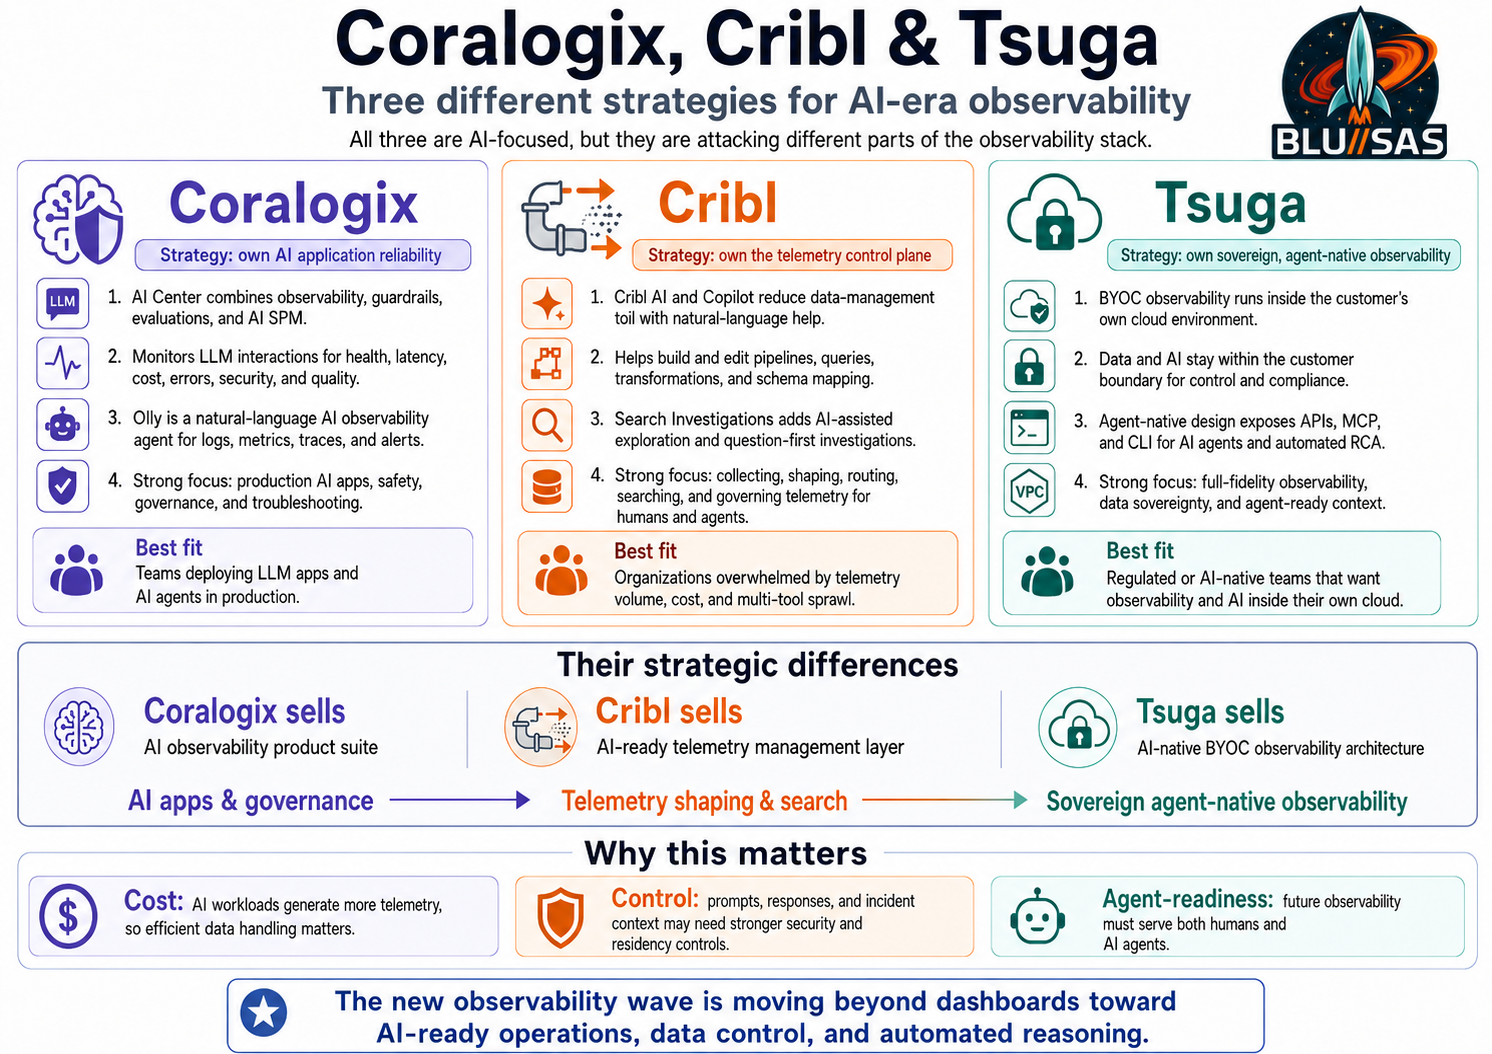
Coralogix is releasing the most explicit “AI observability product suite.” Cribl is positioning itself as the telemetry data layer for AI-era observability. Tsuga is newer and appears to be building an AI-native, bring-your-own-cloud observability architecture rather than simply adding an AI assistant to an old SaaS model.
Quick comparison
Company
AI direction
Product maturity from public material
Coralogix
AI Center, AI guardrails, AI evaluations, AI-SPM, Olly AI observability agent
Very explicit productised AI offering
Cribl
Cribl AI, Copilot, AI-guided Search Investigations, telemetry for humans and agents
Strong AI-assisted telemetry/data-management direction
Tsuga
BYOC observability for the AI era, agent-native observability, MCP/CLI for customer-owned agents
Newer; more architectural and agent-native positioning
1. Coralogix: AI observability as a full product suite
Coralogix is clearly releasing AI-focused products. Its main AI platform is AI Center, which Coralogix describes as a complete platform for AI-powered applications combining observability, guardrails, evaluations, and AI Security Posture Management in one place. It monitors LLM interactions for health, performance, cost, latency, errors, security and quality issues.
The key Coralogix AI products are:
Coralogix AI Center
  ├─ AI Observability
  ├─ AI Guardrails
  ├─ AI Evaluations
  ├─ AI Security Posture Management
  ├─ AI Application Discovery
  └─ AI Explorer / Application Drilldown
What Coralogix is targeting
Coralogix is not just monitoring servers. It is monitoring AI application behaviour:
Its AI Center monitoring gives an organisation-level view of LLM usage and lets teams drill from a trend down to a specific application and even a specific prompt/response interaction.
It also supports OpenTelemetry GenAI semantic conventions, so teams can send GenAI spans into Coralogix AI Center without needing a Coralogix-specific SDK.
Olly: Coralogix’s AI observability agent
Coralogix also has Olly, which it describes as an AI-native observability agent. Olly lets users ask natural-language questions and get answers across logs, metrics, traces and alerts.
In practice, this is the “AI SRE assistant” layer:
Then returns: ├─ explanation ├─ evidence ├─ affected services └─ recommended next steps
Coralogix also positions Olly as more than a simple assistant: it says Olly uses specialised agents for log analysis, trace exploration, metrics interpretation, security research, code debugging, correlation analysis and hypothesis generation.
My read on Coralogix
Coralogix is trying to own AI production reliability:
Monitor AI apps
Evaluate AI outputs
Detect prompt injection / PII / toxicity
Track token cost
Find bad model behaviour
Use AI to investigate normal production incidents
So yes: Coralogix is strongly AI-focused.
2. Cribl: AI platform for telemetry, not classic dashboard observability
Cribl’s AI angle is different. Cribl is not primarily trying to be another Datadog-style full-stack UI. It is positioning itself as the AI Platform for Telemetry: the collection, routing, shaping, searching and governance layer for machine data used by humans and AI agents. Cribl’s homepage describes the platform as giving enterprises choice and control for telemetry, and says it helps manage and analyse telemetry for both humans and agents.
Cribl says its AI capabilities help teams create and modify pipelines, queries and configurations using natural language. It also says Cribl Copilot provides troubleshooting guidance, answers product/configuration questions and helps teams resolve issues faster.
This matters because a lot of observability toil is not just dashboards. It is:
Parse this log format.
Map this schema.
Route this data.
Drop this noisy field.
Mask this sensitive value.
Send this stream to the SIEM.
Send this other stream to cheaper storage.
Cribl’s AI is aimed at reducing that data-engineering toil.
Copilot Editor
Cribl’s Copilot Editor uses AI to help with schema mapping, translating logs across systems and building telemetry pipelines that clean, filter and route events.
That is important because AI-era observability needs clean, standardised telemetry. A reasoning agent is only useful if the data has usable structure.
Cribl Search has an Investigations feature in preview. The docs describe it as a guided workspace where users explore incidents and telemetry using natural-language prompts. It helps analyse telemetry, identify patterns and document findings without manually building every query.
That means Cribl is moving into the AI-assisted investigation workflow:
Alert or question
  ↓
Natural-language investigation
  ↓
Generated queries
  ↓
Pattern discovery
  ↓
Findings captured in one workspace
Cribl’s AI observability thesis
Cribl’s recent AI observability messaging is that AI observability is a telemetry problem, not just a dashboard problem. It argues that LLM apps generate prompts, completions, tool calls, retrieval steps, token counts, model choices, policy events and infrastructure signals, and that those need to be collected and shaped for different teams and tools.
My read on Cribl
Cribl is not saying:
“We are the AI RCA dashboard.”
It is saying:
“We are the telemetry control plane that makes AI investigations possible.”
That is strategically clever. AI agents need cheap, governed, high-quality access to large telemetry volumes. Cribl wants to be the pipe, filter, schema and search layer underneath that.
3. Tsuga: AI-native observability architecture, still early
Tsuga is the newest and least mature publicly compared with Coralogix and Cribl, but it is very clearly positioning itself around the AI-era observability problem.
Tsuga describes itself as a bring-your-own-cloud observability platform for logs, metrics, traces and APM, deployed inside the customer’s AWS account using infrastructure-as-code. It says customers get the control of self-hosted infrastructure without the operational burden of running it.
Its newer positioning is explicitly AI-era focused. Tsuga announced a $35 million Series A on June 23, 2026, saying it is building “observability for the AI era” inside the customer’s cloud so the customer’s data and AI do not leave their control.
Tsuga’s AI claim
Tsuga’s argument is architectural:
Traditional observability:
  telemetry leaves your cloud
  vendor stores it
  cost rises with volume
  AI agents require broad access to vendor-hosted data

Tsuga model:
  observability runs inside your cloud
  telemetry stays inside your perimeter
  AI runs on your own data
  agents can use complete telemetry without exporting sensitive context
Tsuga says its AI tools run on the customer’s data inside the customer’s perimeter. It also says automated root-cause analysis runs on complete, unsampled data, and that its MCP server and CLI let engineering teams build their own agents on that foundation inside their own security boundary.
That MCP point is important. It suggests Tsuga is not only building an observability UI; it is exposing observability context to AI agents.
Agent-native observability
Tsuga has a specific Agent-Native Observability page. It says Tsuga is built so AI agents can use observability data effectively, affordably and inside the customer environment. It highlights agent-first APIs, MCPs, CLIs and query interfaces designed to return relevant context rather than raw data dumps.
That is a very modern product angle.
AI agent asks: “What changed before this incident?”
So my assessment is: yes, Tsuga is AI-focused, but the public product story is currently more architectural and agent-native than feature-by-feature like Coralogix.
The strategic differences
Coralogix: “Observe and govern AI applications”
Coralogix is focused on production AI application reliability:
LLM monitoring
AI guardrails
Evaluations
AI security posture
Prompt/response visibility
Olly AI investigation agent
Best fit:
Teams deploying LLM apps and agents who need monitoring, safety, cost tracking and AI-assisted troubleshooting.
Cribl: “Prepare and control telemetry for AI”
Cribl is focused on the telemetry substrate:
Collect once
Shape data
Mask sensitive fields
Route anywhere
Search cheaply
Let humans and agents investigate
Use AI to build pipelines and queries
Best fit:
Large enterprises drowning in telemetry volume, SIEM costs, log routing complexity and multi-tool data sprawl.
Tsuga: “Run AI-era observability inside your own cloud”
Tsuga is focused on sovereign, cost-controlled, agent-native observability:
BYOC deployment
Telemetry stays in your cloud
AI and agents run inside your boundary
Automated RCA on unsampled data
MCP/CLI for custom SRE agents
Best fit:
Regulated, European, AI-native or high-scale companies that do not want telemetry, prompts, incident history and operational context exported to a third-party SaaS cloud.
The bigger market pattern
These newer players are attacking the incumbents from three angles:
1. Cost
   AI generates more telemetry.
   Per-GB SaaS observability becomes painful.

2. Data control
   AI telemetry includes prompts, responses, business context and security-sensitive data.
   Customers do not always want that in a vendor cloud.

3. Agent-readiness
   Future observability is not just dashboards for humans.
   AI agents need APIs, context retrieval, governed telemetry access and automated RCA.
So the new wave is less about “AI as a dashboard chatbot” and more about building the data foundation for AI-driven operations.
The sharpest summary is:
Coralogix = AI observability product suite
Cribl     = AI-ready telemetry control plane
Tsuga     = AI-native sovereign observability architecture
For an SRE/observability platform engineer, these companies are worth watching because they indicate where the next jobs and platform designs are going: telemetry engineering, AI-readable context, agent-safe access, automated RCA, guardrails and cost-controlled observability architectures.
Opensource AI Observability
AI adoption in open-source observability is happening, but it is different from what Datadog, Dynatrace, Splunk and New Relic are doing.
The commercial vendors are embedding AI directly into their SaaS platforms. The open-source ecosystem is mostly building the standards, collectors, SDKs, self-hostable platforms and agent interfaces that allow AI observability to work without vendor lock-in.
OpenTelemetry + collectors + traces + logs + metrics + AI metadata ↓ LLM / agent / RAG / GPU / vector DB visibility ↓ AI assistants, AI SRE agents, natural-language querying, RCA
1. Grafana: open observability stack + AI features around it
Grafana Labs is moving in two directions.
First, it is keeping the open observability stack relevant for AI-era workloads: Grafana, Loki, Mimir, Tempo, Pyroscope and Alloy remain the core telemetry stack.
Second, it is adding AI-powered layers on top, especially in Grafana Cloud.
Grafana’s AI Observability product is built on OpenTelemetry and is aimed at teams running LLM agents in production. It monitors agent activity, traces conversations, tracks costs and evaluates quality. Grafana documents SDK support for Go, Python, TypeScript, Java and .NET, plus integrations with frameworks such as LangChain, LangGraph, OpenAI Agents and Vercel AI SDK.
Grafana also has Grafana Assistant, an AI-powered observability agent. It lets users ask questions like “Show me CPU usage” or “Create a dashboard for my database,” and it works across metrics, logs, traces, profiles and databases. Grafana says it can run investigations, manage dashboards, build/refine queries and help users navigate Grafana resources.
The important nuance: Grafana Assistant is not the same thing as open-source Grafana itself. It is primarily a Grafana Cloud AI capability, though Grafana documents a self-managed Assistant app that connects to a Grafana Cloud stack with reduced functionality.
Grafana’s most open-source-relevant AI move is probably Grafana Alloy. Alloy is Grafana Labs’ open-source OpenTelemetry Collector distribution with built-in Prometheus pipelines and support for metrics, logs, traces and profiles. It gives Grafana a standard collector layer for AI-era telemetry pipelines.
So Grafana’s strategy is:
Grafana AI strategy:

Open-source base:
  Grafana
  Loki
  Mimir
  Tempo
  Pyroscope
  Alloy

AI observability:
  LLM / agent traces
  cost tracking
  quality evaluation
  AI workload dashboards

AI assistant:
  natural-language querying
  dashboard creation
  investigation assistance
  query generation

Strategic direction:
  keep the OSS stack open,
  but place high-value AI workflows in Grafana Cloud.
2. OpenTelemetry: the standard layer for AI observability
OpenTelemetry is not a company; it is a CNCF open-source project. Its role is different from Grafana’s.
OpenTelemetry is becoming the standard telemetry schema and instrumentation layer for AI systems.
OpenTelemetry describes itself as an open-source observability framework for cloud-native software, providing APIs, libraries, agents and collector services for capturing telemetry. It also emphasises vendor-neutral instrumentation, meaning you instrument once and export to different backends.
For AI, the key development is OpenTelemetry semantic conventions for generative AI. OpenTelemetry has been extending its conventions so GenAI telemetry can capture model parameters, response metadata, token usage, traces, metrics and events for model interactions.
That matters because LLM systems need new telemetry fields that normal web apps did not need:
Traditional app telemetry:
  service.name
  http.status_code
  duration
  error
  route
  database call

AI app telemetry:
  model name
  prompt
  completion
  token count
  tool call
  retrieval step
  vector DB query
  embedding model
  cost
  temperature
  hallucination score
  safety evaluation
OpenTelemetry is not trying to become an AI assistant. Its value is that it gives the ecosystem a common language for AI telemetry.
Strategic direction: become the neutral telemetry contract for AI applications.
3. OpenLIT: open-source LLM observability on OpenTelemetry
OpenLIT is a good example of the new generation of open-source AI observability projects.
It describes itself as an open-source LLM observability and AI engineering platform built on OpenTelemetry. Its positioning is self-hosted, privacy-first and vendor-neutral.
This is important because many companies do not want prompts, responses, user inputs, sensitive data or AI-agent traces going straight into a third-party SaaS.
Best fit: teams building AI apps who want open-source AI observability without committing to a commercial platform first.
4. Langfuse: open-source LLM tracing and evaluation
Langfuse is another major open-source AI observability project.
It focuses on LLM application tracing: capturing prompts, model responses, token usage, latency, tool calls and retrieval steps. Langfuse also provides AI-engineering features such as LLM-as-judge evaluation, prompt management, experiments and datasets, and it can be self-hosted.
Langfuse is less like “Grafana for all infrastructure” and more like “observability and evaluation for LLM applications.”
Best fit: AI product teams who need to debug and improve LLM apps, not just monitor infrastructure.
5. SigNoz: open-source observability with AI-agent access
SigNoz is moving from being an open-source Datadog/New Relic alternative into a more AI-aware observability platform.
SigNoz describes itself as an open-source observability tool powered by OpenTelemetry, covering logs, metrics, traces, dashboards, alerts and LLM/AI observability. It also advertises an MCP server for bringing telemetry into coding agents and an AI teammate called Noz for incident investigation, alert tuning and dashboard building.
This is significant because it shows a broader open-source pattern: observability platforms are not just adding AI dashboards; they are exposing telemetry to AI agents.
SigNoz direction:

OpenTelemetry-native observability
  +
LLM/AI observability
  +
MCP access for coding agents
  +
AI teammate for investigations and dashboards
That is where open-source observability is going: not just dashboards for humans, but context APIs for agents.
6. HolmesGPT: open-source AI SRE agent
HolmesGPT is another important example because it is not primarily about observing LLM apps. It is about using AI to investigate production incidents.
HolmesGPT describes itself as an open-source AI agent for investigating production incidents and finding root causes across Kubernetes, VMs, cloud providers, databases and SaaS platforms. It is listed as a CNCF sandbox project.
That puts it closer to the Datadog Bits AI / Dynatrace Davis AI direction, but in open-source form.
HolmesGPT strategy:

Input:
  alerts
  Kubernetes state
  metrics
  logs
  cloud context
  runbooks

AI task:
  investigate incident
  gather evidence
  find probable root cause
  explain next action

Best fit:
  platform teams wanting an open-source AI SRE layer
  over existing observability tools.
The overall open-source adoption pattern
Open-source observability is adopting AI in four layers.
1. AI telemetry standards
This is where OpenTelemetry is most important.
Goal: make AI applications observable in a standard way
This matters because future AI coding agents and SRE agents will need access to production telemetry to debug issues. The observability stack must become queryable by both humans and machines.
The key difference from commercial observability
Commercial vendors are building polished AI experiences inside their own SaaS platforms.
Open-source observability is building the portable foundations:
Layer
Open-source approach
Instrumentation
OpenTelemetry SDKs and semantic conventions
Collection
OpenTelemetry Collector, Grafana Alloy
Storage/query
Grafana LGTM, SigNoz, ClickHouse-based stacks
AI app tracing
OpenLIT, Langfuse, OTel GenAI conventions
AI SRE
HolmesGPT, MCP-enabled tools
Agent access
MCP, APIs, CLI workflows
The strategic difference is:
Commercial vendors:
  "Use our platform and our AI will help you."

Open-source ecosystem:
  "Instrument once, own your data, expose telemetry to any backend or AI agent."
What this means for SREs and observability engineers
The valuable skill is moving from only operating dashboards to building an AI-readable telemetry platform.
That means:
You need:
  consistent OpenTelemetry attributes
  clean service names
  good resource metadata
  deployment markers
  trace/log/metric correlation
  AI workload spans
  token/cost metrics
  evaluation signals
  MCP or API access for agents
  guardrails around sensitive telemetry
For a homelab or professional platform, the modern open-source direction would be:
Grafana is making the open observability stack AI-aware.
OpenTelemetry is becoming the standard language for AI telemetry.
OpenLIT, Langfuse and SigNoz are making LLM apps observable.
HolmesGPT-style tools are turning open telemetry into AI-assisted SRE investigations.
So, yes: open-source observability is adopting AI quickly, but the centre of gravity is different. The open-source world is less about one vendor-owned AI brain and more about open telemetry, self-hostable AI observability, and agent-ready operations.
The AI infrastructure race is being led by a relatively small number of corporations, but together they represent well over US$1 trillion of planned investment over the remainder of this decade. Many figures below are approximate because companies often announce campuses or regions rather than exact building counts, and projects evolve rapidly.
Corporation
Operational data centres (approx.)
AI data centres planned / under construction
Main locations
Amazon Web Services
100+ availability zones across 36+ regions
Dozens of new AI campuses through 2028 (including Project Rainier)
USA (Virginia, Pennsylvania, Georgia, Mississippi, Oregon), Europe, UK, Germany, India, Japan, Australia
Microsoft
300+ data centres globally
Tens of new AI campuses; ~$80B AI infrastructure investment
USA, Sweden, Finland, UK, Germany, Australia, Japan, Texas, Wisconsin
Google
40+ cloud regions and many hyperscale campuses
Multiple new AI mega-campuses
Ohio, Nebraska, Oklahoma, Texas, Iowa, Europe, Asia
Meta
20+ hyperscale campuses
Numerous AI campuses under expansion
Louisiana, Ohio, Iowa, Texas, Alabama, with additional capacity from Crusoe
Oracle
80+ cloud regions
Multi-gigawatt AI campuses via Stargate plus Oracle Cloud expansion
Texas, New Mexico, Ohio, Michigan and other US states
OpenAI
Operates via partners rather than owning a global DC fleet
Stargate aims for roughly 20 major AI campuses
Texas, New Mexico, Ohio, Wisconsin, Michigan and additional US sites
SoftBank
No major hyperscale cloud estate
Co-investor in Stargate
United States (multiple campuses)
CoreWeave
~30+ AI data centres
Continuing rapid expansion
USA, UK, Norway, Spain and additional European sites
xAI
1 flagship AI supercluster (Colossus) plus expansions
Expanding toward one million GPUs
Memphis, Tennessee and additional US locations
Crusoe
Several AI campuses under operation
Multiple campuses for OpenAI, Meta and Microsoft
Texas, Oklahoma and other US states
Nscale
Early-stage AI infrastructure
UK and European sovereign AI facilities planned
United Kingdom, Norway and Europe (build-out still in early stages)
Where the biggest build-out is happening
The current hotspots are:
Texas – by far the largest concentration, with Stargate, Oracle, Microsoft, Google and xAI all investing heavily.
Ohio – Google, Meta and Oracle are all expanding there.
Louisiana – Meta’s enormous AI campus.
Virginia – still the world’s largest concentration of conventional cloud data centres.
Pennsylvania, Georgia and Oklahoma – major AWS and Google investments.
Wisconsin, Michigan and New Mexico – emerging AI infrastructure hubs.
The scale is unprecedented
The six largest AI infrastructure builders (Amazon, Microsoft, Google, Meta, Oracle and the Stargate consortium) have collectively committed around US$690–700 billion in AI-related capital expenditure, with 74 new AI-focused projects breaking ground in the US during 2026 alone. Longer-term projections suggest total AI infrastructure investment could exceed US$5 trillion globally by 2030.
One notable trend is that these companies are no longer building isolated data centres. They are constructing AI campuses consisting of anywhere from 8 to more than 20 individual data-centre buildings, all linked by ultra-high-speed networking so they function as a single giant AI supercomputer. A single campus can consume 500 MW to over 1 GW of power, equivalent to the electricity demand of a medium-sized city.
The largest AI campuses consume enormous quantities of resources. Some impacts are already measurable, while others remain uncertain and depend on how utilities allocate costs. It’s important to distinguish local effects (which can be substantial) from national effects (which are often much smaller).
Resource
How AI campuses use it
Impact on consumers
Electricity
Hundreds of MW to several GW continuously
Higher utility investment, possible higher electricity bills in constrained regions, increased need for new power stations
Water
Cooling systems can consume millions of gallons per day, although newer designs increasingly use closed-loop or air cooling
Competition for water in drought-prone areas; pressure on municipal supplies
Land
Campuses often occupy hundreds to thousands of acres
Industrial land values rise; reduced land available for other development
Construction materials
Steel, concrete, copper, fibre-optic cable
Higher demand can contribute to material price increases, though AI is only one of several drivers
Electrical equipment
Transformers, switchgear, substations
Longer lead times for utilities and industrial customers
Electrical engineers, construction workers, data-centre technicians
Wage competition and labour shortages in some regions
Natural gas
Some campuses are building dedicated gas-fired generation
Increased demand for gas infrastructure and fuel in certain markets
Electricity prices
Electricity is the area where households are most likely to notice an effect.
Large AI campuses require utilities to invest in:
New transmission lines
New substations
Additional generation
Grid upgrades
Who pays depends on regulation.
In some regions, regulators are trying to ensure that AI companies pay most of these costs. In others, some infrastructure costs are spread across all customers, which can increase household bills.
For example:
Region
Reported effect
PJM (eastern U.S.)
Wholesale electricity prices rose sharply as demand from AI data centres increased, prompting calls for tech companies to fund more of the required infrastructure.
Arizona
Utilities warn that electricity infrastructure may need to roughly double within a few years because of AI growth.
Virginia
Data centres already account for a very large share of electricity demand in some parts of the state.
It’s also worth noting that recent academic work found that, historically (2015–2024), data centres slightly reduced average U.S. electricity prices by helping spread fixed grid costs over more customers. The authors caution that this may not hold if future supply constraints become severe.
Water
Water is highly location-dependent.
Older evaporative cooling systems can use several million gallons of water per day. Newer AI facilities increasingly employ:
Closed-loop liquid cooling
Direct-to-chip liquid cooling
Air cooling where practical
These approaches can significantly reduce freshwater consumption, but water remains a concern in arid regions.
Housing
AI campuses can affect local housing markets by:
Bringing thousands of construction workers
Creating highly paid engineering jobs
Increasing demand for rental accommodation
The effect is usually local rather than national.
Employment
Benefits include:
Construction employment
Electrical contracting
Operations and maintenance jobs
Security
Network engineering
Mechanical engineering
However, once operational, AI campuses employ far fewer people than factories of similar size.
Have prices increased?
Evidence is mixed:
Item
Observed trend
Electricity
Some U.S. regions have seen higher wholesale prices and concerns about retail bills where AI demand is concentrated.
Water
Mostly local impacts in water-stressed regions rather than broad consumer price rises.
Housing
Local increases around major developments are common, though driven by multiple factors.
Construction materials
Increased demand contributes to pressure, but AI is only one of many drivers.
Consumer goods
There is currently little evidence that AI data centres have directly increased the prices of everyday retail goods.
Overall, the greatest measurable impact today is on electricity infrastructure. The International Energy Agency projects that global data-centre electricity consumption will more than double to about 945 TWh by 2030, driven largely by AI. Whether households ultimately pay more depends on regulatory decisions about who funds the new power plants, transmission lines and substations needed to support these AI campuses.
Changing Jobs and Roles
The AI infrastructure boom is creating the largest shift in infrastructure engineering since the rise of public cloud around 2006–2015. Traditional cloud providers needed engineers to build reliable, scalable services for virtual machines, storage and networking. AI Factories require all of that plus expertise in GPUs, ultra-high-speed networking, power engineering, liquid cooling and AI software platforms.
Evolution of Infrastructure Engineering
Era
Primary Goal
Main Infrastructure
Typical Employer
Enterprise IT (1990–2010)
Business applications
Servers, SAN, LAN
Banks, government, enterprises
Cloud (2006–2024)
Multi-tenant cloud services
Hyperscale datacenters
AWS, Azure, Google Cloud
AI Factory (2024–2035+)
Massive AI computation
GPU supercomputers, AI campuses
OpenAI, Meta, xAI, Oracle, CoreWeave, Nscale, AWS
Traditional Cloud Provider Jobs
Cloud providers traditionally organised engineering into around a dozen major disciplines.
Applications Containers Virtual Machines Hypervisor Servers Storage Networking Power
AI Factory:
AI Models Distributed Training Kubernetes / Slurm CUDA / ROCm 100,000+ GPUs InfiniBand / RoCE Parallel Storage Liquid Cooling Gigawatt Power
Traditional Cloud Skills
Linux
VMware
Kubernetes
OpenStack
AWS
Azure
Terraform
Ansible
Prometheus
Grafana
Python
Go
Storage
Networking
New AI Factory Skills
Additional skills now becoming highly valuable include:
NVIDIA GPU architecture
AMD Instinct
CUDA
NCCL
GPUDirect RDMA
InfiniBand
RoCE v2
Slurm
Ray
Kubeflow
MLFlow
Triton Inference Server
Parallel file systems (Lustre, IBM Storage Scale/GPFS, BeeGFS)
High-performance Ethernet (400/800 GbE)
Direct-to-chip liquid cooling
Rack-scale power engineering
Jobs Growing Fastest
Role
Growth Outlook
GPU Infrastructure Engineer
Extremely High
AI Platform Engineer
Extremely High
HPC Systems Engineer
Extremely High
Kubernetes Platform Engineer
Very High
Storage Engineer
Very High
Site Reliability Engineer
Very High
Network Fabric Engineer
Extremely High
Power Systems Engineer
Extremely High
Mechanical Cooling Engineer
Extremely High
AI Operations Engineer
Extremely High
Approximate Current Workforce (2025–2026)
The exact numbers are difficult to measure because many roles overlap, but industry estimates suggest:
Profession
Estimated Global Workforce
Cloud Engineers
2–3 million
DevOps Engineers
1.5–2 million
Site Reliability Engineers
400,000–700,000
Kubernetes Engineers
500,000–900,000
Datacenter Engineers
300,000–500,000
Storage Engineers
200,000–350,000
HPC Engineers
80,000–150,000
GPU Infrastructure Specialists
20,000–40,000
AI Infrastructure Engineers
50,000–100,000
Estimated Workforce Needed by 2030
As AI campuses proliferate worldwide, demand is expected to increase significantly.
Profession
Estimated Demand by 2030
AI Infrastructure Engineers
300,000–500,000
GPU Cluster Engineers
150,000–250,000
HPC Engineers
250,000–400,000
SREs (AI/Cloud)
800,000–1.2 million
Kubernetes Platform Engineers
1–1.5 million
Network Fabric Engineers
300,000–500,000
Storage Engineers
500,000+
Power Engineers
400,000–700,000
Cooling Engineers
250,000–500,000
These are indicative estimates derived from announced AI infrastructure expansion plans and broader industry workforce analyses rather than official forecasts.
Where the Talent Is Coming From
Most AI Factory engineers are not newly trained graduates. Companies are recruiting experienced professionals from adjacent disciplines:
Previous Role
Transition To
Cloud Engineer
AI Platform Engineer
Kubernetes Engineer
AI Infrastructure Engineer
SRE
AI Operations Engineer
HPC Engineer
GPU Cluster Engineer
Linux Engineer
GPU Systems Engineer
Network Engineer
InfiniBand/RoCE Fabric Engineer
Storage Engineer
AI Storage Architect
OpenStack Engineer
AI Cloud Platform Engineer
Ceph Engineer
High-performance Storage Engineer
DevOps Engineer
ML Platform Engineer
Why This Matters
The next decade is likely to see a shift similar to the transition from enterprise IT to cloud computing. During the 2010s, the most sought-after roles were Cloud Engineers, DevOps Engineers and SREs. Through the late 2020s and into the 2030s, many of the highest-demand infrastructure roles are expected to centre on AI Factories: designing, building and operating gigawatt-scale GPU campuses, high-performance storage systems, ultra-low-latency networks and AI platforms.
For someone with expertise in Linux, Kubernetes, observability, automation, storage and cloud infrastructure, the progression into AI infrastructure engineering is relatively direct. Adding knowledge of GPU platforms, HPC networking (InfiniBand/RoCE), parallel storage (such as Lustre or GPFS), Slurm, CUDA and liquid-cooled datacenter design positions engineers for many of the roles expected to see the strongest demand over the coming decade.
Part of the 4th Industrial Revolution
Yes — this is plausibly the tail-end phase of the Forth Industrial Revolution, but with one caveat: we do not yet know whether AGI/ASI will arrive, or when. What is clear is that capital, land, power, water, chips, networks and engineering labour are being redirected toward AI factories.
The simplest framing:
Industrial phase
Core machine
Main resource
Main labour shift
1st
Steam engine
Coal
Farm → factory
2nd
Electrified production line
Oil, steel, electricity
Craft → mass production
3rd
Computer
Silicon, software
Clerical → digital
4th
Cloud + automation
Data, networks, platforms
IT → cloud/SRE/DevOps
5th
AI factory
Compute, power, GPUs, data
Human labour → AI-augmented/AI-directed labour
The AI factory is the new “mill.” Instead of spinning cotton or stamping cars, it converts electricity + chips + data + models into intelligence services: code, design, analysis, customer support, robotics control, synthetic media, drug discovery and eventually autonomous decision systems.
The resource pull is already visible. The IEA projects global data-centre electricity consumption could roughly double to about 945 TWh by 2030, growing far faster than general electricity demand. That is why hyperscalers, AI labs and neoclouds are racing to secure power, grid connections, GPUs, cooling, land and engineering staff.
On jobs, the likely pattern is not “all jobs disappear.” It is task compression: fewer people needed for routine cognitive work, more people needed for infrastructure, supervision, security, robotics, energy, regulation and high-complexity design. Goldman Sachs has estimated that AI could expose the equivalent of 300 million full-time jobs globally to automation, while the World Economic Forum projects by 2030 about 170 million roles created and 92 million displaced, for a net gain of 78 million under its surveyed-employer scenario.
AI compliance officer, algorithmic accountability auditor
Human-AI work
Agent orchestrator, prompt/workflow architect, AI operations manager
Synthetic worlds
Simulation designer, digital twin engineer, synthetic-data engineer
If AGI arrives, the shift accelerates. If ASI arrives, the shift becomes civilisational: the scarce resources may become energy, compute rights, physical materials, robotics capacity, trusted governance and human legitimacy, rather than ordinary labour.
So yes: the AI build-out looks like the physical foundation of a Fifth Industrial Revolution — not just software, but a new industrial base built around manufactured intelligence.
Climate change and broader sociological factors are arguably the largest long-term uncertainties for the Fifth Industrial Revolution. Unlike technical bottlenecks, they can alter not just the pace of AI adoption but also where, how, and for whom AI infrastructure is built.
I don’t think climate change will stop the AI revolution, but it could fundamentally reshape it. History suggests industrial revolutions adapt to resource constraints rather than ending because of them.
Climate change
1. Energy transition
Today’s AI factories consume enormous amounts of electricity.
If climate policies tighten globally, AI companies may no longer be able to rely on inexpensive fossil-fuel generation.
This is already pushing investment towards:
Nuclear power
Small Modular Reactors (SMRs)
Geothermal
Offshore wind
Utility-scale solar
Long-duration batteries
Grid-scale storage
By the 2040s, a successful AI company may be judged as much by its carbon intensity per AI token as by its model quality.
2. Water shortages
Many AI campuses currently use water-intensive cooling.
Increasing droughts could force AI factories to relocate.
Future AI campuses are likely to favour:
Scotland
Norway
Sweden
Finland
Iceland
Canada
Pacific Northwest
Patagonia
Cool climates reduce cooling costs while providing more reliable water supplies.
3. Sea-level rise
Many current datacentres sit near coasts because they benefit from:
Fibre landing stations
Major cities
Existing infrastructure
Over decades, flood risks may encourage more inland development.
4. Extreme weather
Increasingly frequent:
Heatwaves
Wildfires
Hurricanes
Flooding
all increase operational risks.
Future campuses may need:
Greater redundancy
Fire-resistant designs
Multiple grid connections
Larger battery systems
Independent power generation
Resource nationalism
Countries increasingly recognise compute as a strategic asset.
Competition may intensify over:
Lithium
Copper
Rare earth elements
Uranium
Semiconductor-grade silicon
Freshwater
Electricity
The next century may see competition over compute capacity much as the twentieth century saw competition over oil.
Demographics
Many developed nations face ageing populations.
This may actually accelerate AI adoption.
Examples include:
Japan
South Korea
Germany
Italy
If fewer working-age people are available, automation becomes economically attractive.
Education
Universities are already adapting.
Future curricula may emphasise:
AI engineering
Robotics
HPC
Power engineering
Semiconductor engineering
AI governance
Routine programming skills alone may become less valuable than systems integration, critical thinking and domain expertise.
Public trust
AI adoption depends heavily on social acceptance.
Concerns include:
Surveillance
Privacy
Bias
Deepfakes
Autonomous weapons
Job displacement
Public backlash could lead to stricter regulation or slower deployment in some sectors.
Wealth inequality
One of the most significant risks is that AI could concentrate wealth among those who own:
AI models
Compute infrastructure
Semiconductor intellectual property
Energy assets
Data
If productivity gains are not widely shared, inequality could increase.
Possible policy responses include:
Expanded education and retraining
Wage insurance
Stronger competition policy
Tax reforms
New social safety nets
Different countries are likely to pursue different approaches.
Employment transition
Industrial revolutions historically eliminate some jobs while creating others.
The challenge is timing.
If AI removes work faster than new roles appear, societies may experience:
Higher unemployment
Political instability
Reduced consumer spending
Pressure for labour-market reforms
Managing this transition is likely to be one of the defining policy challenges of the coming decades.
Geopolitics
Compute is becoming a strategic resource.
This may encourage blocs centred around:
North America
Europe
China
India
Middle East
Each could develop increasingly independent AI ecosystems, supply chains and regulations.
Alternative futures
Scenario
AI build-out
Society
Green AI Revolution
AI powered largely by low-carbon energy; highly efficient hardware
AI helps accelerate decarbonisation and scientific progress
AI Arms Race
National security drives rapid expansion despite environmental costs
Fragmented AI ecosystems and geopolitical competition
AI Bubble
Infrastructure investment slows after poor returns
AI remains important but grows more gradually
Climate Adaptation AI
AI prioritises climate modelling, energy optimisation and resilient infrastructure
AI becomes a key tool for adapting to climate change
Post-Scarcity Transition(speculative)
Abundant clean energy and highly capable AI dramatically reduce production costs
Work shifts towards creativity, care, governance and exploration
The “AI Factory Economy”
A useful way to think about the long term is that AI factories may become a new class of critical infrastructure, similar to:
Power stations
Railways
Ports
Telecommunications
The Internet
The economy could evolve around interconnected systems:
Clean Energy │ ▼ AI Factories │ ▼ Robotics + Software + Scientific Discovery │ ▼ Higher Productivity │ ▼ Lower Cost of Goods and Services │ ▼ More Resources Available for Society
That is an optimistic pathway. A less favourable outcome is also possible if productivity gains are unevenly distributed, infrastructure cannot keep pace, or environmental constraints become more severe.
The most important sociological question
The defining issue may not be whether AI becomes powerful enough—it almost certainly will continue to improve significantly. The larger question is who benefits from the productivity gains.
Previous industrial revolutions eventually raised average living standards, but they also brought decades of disruption, labour conflict and institutional change. The Fifth Industrial Revolution, if it unfolds as many expect, is likely to follow a similar pattern: technological progress may be rapid, but the economic and social institutions needed to distribute its benefits will evolve more slowly.
In other words, the success of the Fifth Industrial Revolution may depend less on building bigger AI factories and more on how societies adapt their education systems, labour markets, energy infrastructure and governance to make effective use of the capabilities those AI factories create.
Post-quantum cryptography, often abbreviated as PQC, is the field of cryptography that designs algorithms believed to remain secure even if an attacker has a powerful quantum computer.
The important point is this: PQC does not usually mean using quantum computers to encrypt data. It means using new mathematical problems that run on normal classical computers but are designed to resist both classical and quantum attacks.
Today, much of the internet depends on public-key cryptography such as:
RSA
Diffie–Hellman
Elliptic Curve Diffie–Hellman
ECDSA / EdDSA digital signatures
These are used in TLS, SSH, VPNs, software updates, code signing, certificates, identity systems, cloud platforms, messaging systems, package repositories, Kubernetes components, firmware signing, and more.
The issue is that a sufficiently capable quantum computer running Shor’s algorithm could break RSA, finite-field Diffie–Hellman, and elliptic-curve cryptography by solving the underlying factoring and discrete logarithm problems much faster than classical computers can. NIST’s post-quantum cryptography programme exists specifically to standardise replacements for these vulnerable public-key algorithms.
Attackers could forge identities, software updates, certificates, tokens
Long-lived encrypted data
TLS, VPNs, backups, archives
Captured ciphertext may be decrypted later
PKI and certificates
RSA/ECDSA certificates
Trust chains could be undermined
Symmetric cryptography is less affected. Algorithms like AES and SHA-2/SHA-3 are not “broken” by Shor’s algorithm. Grover’s algorithm gives a quadratic speedup against brute force search, so the normal response is to use larger symmetric keys, for example AES-256 rather than AES-128 for high-value long-term protection.
The core PQC idea
PQC replaces vulnerable public-key primitives with algorithms based on problems believed to be hard for both classical and quantum computers.
The main families include:
PQC family
Example
Common use
Lattice-based
ML-KEM, ML-DSA
Key exchange, signatures
Hash-based
SLH-DSA
Digital signatures
Code-based
Classic McEliece, HQC
Encryption / KEM research and candidates
Multivariate
Historically studied, many broken
Mostly not favoured for general deployment
Isogeny-based
SIKE was broken
Largely a cautionary example
The most important current standards are the NIST FIPS standards released in August 2024:
Standard
Algorithm
Purpose
FIPS 203
ML-KEM
Key encapsulation / key establishment
FIPS 204
ML-DSA
Digital signatures
FIPS 205
SLH-DSA
Stateless hash-based digital signatures
NIST released the first three finalised post-quantum encryption and signature standards in August 2024: ML-KEM, ML-DSA, and SLH-DSA.
Why it matters
A quantum computer running Shor’s algorithm could break the maths behind:
RSA encryption
Elliptic Curve Cryptography
Diffie–Hellman key exchange
Digital signatures such as ECDSA
Shor’s algorithm is the canonical reason RSA, finite-field Diffie–Hellman, and elliptic-curve systems are considered quantum-vulnerable.
The most important point here is that many systems use vulnerable public-key cryptography not only for encryption, but for trust.
Certificates, API auth, secure service-to-service communication
Git / CI/CD
SSH keys, signed commits, deployment credentials
A major PQC migration therefore affects far more than “web encryption”. It touches infrastructure identity, authentication, software provenance, device trust, secure boot, PKI, and long-lived secrets.
The store now, decrypt later threat
It shows three stages:
Attacker captures encrypted data today
Data is stored for years
A future quantum computer decrypts the data
This is also known as:
Harvest now, decrypt later
Store now, decrypt later
Retrospective decryption
Long-horizon confidentiality risk
This matters because not all data loses value quickly. Some data remains sensitive for decades.
The infographic lists data at risk:
At-risk category
Why it matters
Government and military communications
National security information may remain sensitive for decades
Health records
Medical data is long-lived and highly personal
Intellectual property
Designs, algorithms, research, trade secrets
Financial data
Transactions, account information, business strategy
Long-term secrets and credentials
Root keys, signing keys, archival secrets, identity material
This is the right risk model. A criminal or state actor does not need a quantum computer today. They only need storage, patience, and access to encrypted traffic or archives.
The key architectural lesson is:
Data with a long confidentiality lifetime should be migrated first.
A short-lived session token that expires in 15 minutes is less urgent than a 20-year government archive, private health record, root CA key, firmware signing key, or sensitive research dataset.
What is post-quantum cryptography?
PQC uses new mathematical problems believed to be hard for both classical and quantum computers.
PQC approaches:
Lattice-based, for example ML-KEM
Code-based
Hash-based
Multivariate
The practical deployment landscape is now heavily centred on lattice-based and hash-based schemes.
Lattice-based cryptography
This is currently the most important family for general-purpose PQC.
Examples:
Algorithm
Standard name
Use
Kyber
ML-KEM
Key establishment
Dilithium
ML-DSA
Digital signatures
ML-KEM is especially important because it is the main replacement candidate for ECDH-style key establishment in protocols such as TLS, VPNs, SSH-like systems, and other secure channels.
Hash-based signatures
Hash-based signatures are conservative because they rely mainly on the security of cryptographic hash functions.
Example:
Algorithm
Standard name
Use
SPHINCS+
SLH-DSA
Stateless digital signatures
Hash-based signatures can be larger and slower than classical signatures, but they provide a useful conservative option for certain signing use cases.
Code-based cryptography
Code-based cryptography has a long history, especially McEliece-style systems. It can offer strong security confidence, but public keys can be large, which complicates deployment.
Multivariate cryptography
This family has had many proposals broken over time. It is still academically relevant, but it is not the main current deployment path for mainstream PQC.
ML-KEM, a post-quantum key encapsulation mechanism
The resulting shared secret is derived from both components.
The security logic is:
Scenario
Result
Classical algorithm remains secure
Session remains secure
PQC algorithm remains secure
Session remains secure
One component later has a weakness
The other component may still protect the session
Both are broken
Session fails
Hybrid mode is popular because PQC is still relatively new in production. Combining classical and post-quantum cryptography gives a safer migration path than abruptly replacing everything at once.
This is also why OpenSSH is relevant. OpenSSH has supported post-quantum key agreement by default since OpenSSH 9.0, initially using a hybrid sntrup761x25519-sha512 key exchange.
The infographic says:
“If either one is secure, the session stays secure.”
That is the basic intended property of a well-designed hybrid construction. The practical caveat is that this depends on the combiner, implementation, protocol design, downgrade resistance, and correct negotiation. Bad hybrid composition can still introduce failure modes.
For SRE/platform work, the key things to check are:
Does the protocol support hybrid PQ key exchange?
Is it enabled by default?
Can old clients downgrade the connection?
Are logs available showing negotiated algorithms?
Do load balancers, proxies, TLS terminators, SSH bastions, VPNs, and service meshes support it?
Can certificates and signatures be migrated separately from key exchange?
What breaks when key sizes, signature sizes, or handshake sizes increase?
PQC standardization & timeline
The broad timeline:
2016: NIST launched the PQC standardisation project
NIST launched its post-quantum cryptography standardisation effort to evaluate candidate algorithms and select standards for quantum-resistant public-key cryptography.
2017–2022: evaluation, cryptanalysis, testing
This was the period where many candidate algorithms were submitted, evaluated, attacked, benchmarked, and refined.
This matters because PQC algorithms are not trusted merely because they are new. They are trusted because they survive extensive public cryptanalysis.
2022–2024: standards selected
NIST selected algorithms for standardisation, including key establishment and signature schemes. The final standards were published in 2024 as FIPS 203, FIPS 204, and FIPS 205.
2024+: standards adopted and deployed
This is where the hard work begins. Standardisation is not migration.
A full migration involves:
discovering cryptographic usage
replacing libraries
updating protocols
changing certificates
testing interoperability
updating hardware security modules
upgrading clients and servers
checking compliance
validating performance
monitoring negotiated algorithms
training engineering teams
coordinating suppliers and customers
Migration is “a journey, not a switch.”
Where PQC is being adopted and what an SRE can do
There are several adoption areas.
1. OpenSSH
Current support examples
OpenSSH is one of the clearest places where PQC is already operationally visible.
Modern OpenSSH supports hybrid post-quantum key exchange algorithms such as:
OpenSSH release notes state that mlkem768x25519-sha256 is now used by default for key agreement in supported versions. That means newer clients and servers can negotiate a hybrid key exchange without changing the application layer at all.
How to check support
On both the client and the server, check what key exchange algorithms the installed OpenSSH supports:
ssh -V
ssh -Q kex | grep -Ei 'mlkem|sntrup|ntru|pq'
Check what the server is configured to allow:
sudo sshd -T | grep -i kexalgorithms
From the client side, check what is actually negotiated:
Keep a second session open while testing so you do not lock yourself out.
Add a compliance check to your configuration management:
ssh -G server.example.com | grep -i kexalgorithms
Log and alert on servers that still negotiate only classical KEX.
For Rocky/RHEL-family systems, also check whether system crypto policy is overriding application configuration:
update-crypto-policies --show
The SRE deliverable should be a small dashboard or report showing:
Host class
OpenSSH version
PQ KEX available
PQ KEX negotiated
Action
Bastions
9.x
Yes
Yes
Done
Git server
8.x
No
No
Upgrade
Old appliances
Unknown
No
No
Vendor escalation
2. Web browsers and TLS libraries
Current support examples
This is where PQC adoption is moving quickly.
Google says Chrome enabled ML-KEM by default for TLS 1.3 and QUIC on desktop in May 2024, and that ML-KEM is also enabled on Google servers. Google also notes that Kyber was standardised with changes and renamed ML-KEM, and that ML-KEM was implemented in BoringSSL, Google’s cryptography library.
Cloudflare documents post-quantum key agreement for TLS and states that its PQ key agreements are supported only in protocols based on TLS 1.3, including HTTP/3, and that Cloudflare provides a browser support check through Cloudflare Radar.
Google Cloud Load Balancing now documents support for X25519MLKEM768 as a hybrid key exchange method. When enabled, Google Cloud load balancers use it with clients that advertise TLS 1.3 and X25519MLKEM768; clients that do not support it are unaffected.
OpenSSL 3.5 adds native support for the standardised PQ families ML-KEM, ML-DSA, and SLH-DSA, plus standardised hybrid PQ schemes.
How to check browser-side support
For user/browser verification:
Use a PQ-aware test site such as Cloudflare Radar’s browser support check.
Check the browser version.
Confirm the browser is using TLS 1.3 or HTTP/3/QUIC where applicable.
Capture a TLS handshake with Wireshark and inspect the supported_groups extension for hybrid groups such as X25519MLKEM768.
From an SRE perspective, browser-side validation is useful, but server-side validation is more important.
How to check server-side TLS support
With OpenSSL 3.5 or newer, check whether your local OpenSSL knows about ML-KEM/hybrid groups:
openssl version
openssl list -kem-algorithms 2>/dev/null | grep -Ei 'ML-KEM|MLKEM' || true openssl list -groups 2>/dev/null | grep -Ei 'MLKEM|X25519'
This matters because most current progress is in key exchange, not yet in the full certificate/signature layer.
How to implement TLS PQC as an SRE
The cleanest SRE implementation path is to enable PQC at TLS termination points first:
CDN
cloud load balancer
ingress controller
API gateway
reverse proxy
service mesh gateway
internal mTLS gateway
Do not start by modifying every application.
Practical implementation options:
Option A: CDN / managed edge
For services behind Cloudflare, Google Cloud Load Balancing, AWS, or similar, enable PQ/hybrid TLS at the managed edge where supported.
This gives you:
low operational risk
broad client compatibility
centralised rollout
simpler rollback
better telemetry
Option B: cloud load balancer
For Google Cloud Load Balancing, evaluate and enable post-quantum TLS support using X25519MLKEM768, then observe handshake metrics and client compatibility. Google Cloud states that unsupported clients are unaffected, which is exactly the behaviour you want during migration.
Option C: self-managed reverse proxy / ingress
For Nginx, Envoy, HAProxy, Apache, or Caddy, the question is not only the web server version. It is also the TLS library underneath:
Component
What matters
Nginx
Built against OpenSSL/BoringSSL/AWS-LC with PQ support
Envoy
BoringSSL/AWS-LC capabilities
HAProxy
Linked TLS library and group configuration
Apache httpd
OpenSSL version and TLS config
Kubernetes ingress
Controller image, TLS library, and config surface
Your SRE deployment pattern should be:
Build a canary ingress or gateway.
Enable TLS 1.3 only for the test endpoint.
Add hybrid group support.
Test with PQ-capable clients.
Capture handshakes.
Watch latency, CPU, handshake failure rate, and client error rate.
The missing metric in many environments is tls_key_exchange_group_total. If your proxy does not expose it, you may need access logs, debug logs, eBPF, packet sampling, or custom instrumentation.
For IPsec/IKEv2, strongSwan 6.0 is an important example. strongSwan 6.0 introduced an ml plugin for Module-Lattice-based crypto / ML-KEM, and its documentation shows IKEv2 examples using ML-KEM. A strongSwan test case shows road-warrior clients using hybrid key exchanges such as x25519-ke1_mlkem512 and ecp384-ke1_mlkem768.
Cloudflare has also announced generally available post-quantum encryption for Cloudflare IPsec using hybrid ML-KEM.
Check release notes for ML-KEM, Kyber, post-quantum, hybrid IKE, or hybrid key exchange.
Ask whether PQ is supported for control-plane key establishment, not just marketing-level “quantum safe” claims.
Confirm whether both ends support it.
Confirm whether fallback is classical and whether fallback is logged.
How to implement VPN PQC as an SRE
Prioritise VPNs that protect:
production admin access
site-to-site datacentre links
cloud interconnects
backup replication
privileged remote access
third-party supplier access
For strongSwan, implement in a lab first:
Upgrade to strongSwan 6.x with ML-KEM-capable crypto backend.
Confirm ml plugin or backend support.
Configure hybrid IKE proposal.
Initiate tunnel.
Confirm negotiated proposal in logs and swanctl --list-sas.
Run throughput and latency tests.
Test rekey, failover, NAT traversal, MTU, fragmentation, and DPD.
Roll out to one non-critical tunnel.
Add observability.
You are trying to answer these operational questions:
Question
Why it matters
Does the tunnel still come up after rekey?
PQ KEX may expose rekey bugs
Does MTU/fragmentation change?
Larger key exchange messages can affect IKE
Does the peer silently fall back?
Silent fallback hides risk
Can old clients still connect?
Compatibility management
Are negotiated algorithms logged?
Auditability
Can we roll back cleanly?
Production safety
For commercial VPN/ZTNA providers, your SRE task is vendor assurance:
Please provide evidence of: - Supported PQ/hybrid key exchange algorithms - Whether ML-KEM is FIPS 203 aligned - Whether deployment is default or opt-in - Whether fallback is logged - Which clients/agents support it - Whether IPsec, TLS, WireGuard, or proprietary tunnels are covered - How negotiated algorithms can be exported to SIEM/telemetry
4. Email and messaging
This area is split into two very different worlds:
Modern messaging apps, where PQC is already being deployed.
Traditional email, where PQC is more complex and adoption is slower.
Messaging examples
Signal introduced PQXDH, which incorporates quantum-resistant cryptographic secrets when chat sessions are established, specifically to protect against harvest-now, decrypt-later attacks. Signal later described additional work on post-quantum ratchets.
Apple introduced PQ3 for iMessage, describing it as a protocol combining post-quantum initial key establishment with ongoing ratchets for protection against harvest-now, decrypt-later attacks.
Traditional email examples
For email standards, the work is more fragmented:
OpenPGP has an IETF draft for post-quantum cryptography in OpenPGP, including examples using ML-KEM-768 + X25519.
CMS, which underpins S/MIME-style cryptographic messaging, now has RFC 9936, “Use of ML-KEM in the Cryptographic Message Syntax,” published as a proposed standard in March 2026.
How to check messaging support
For consumer messaging apps, you often cannot inspect negotiated cryptographic parameters directly. So the checks are governance and client-state checks:
Are users on versions that include PQXDH/PQ3 or equivalent?
Is the feature enabled by default?
Is the communication end-to-end encrypted?
Are backups also protected?
Are all devices in the conversation upgraded?
Is there vendor documentation for the exact protocol?
For enterprise messaging platforms, ask the vendor:
Do you support post-quantum or hybrid key establishment? Is this for transport TLS only, message E2EE, or both? Are mobile, desktop, and web clients all covered? Are backups covered? Can admins see rollout status? Can non-upgraded clients force downgrade?
Check whether your OpenPGP implementation supports PQC draft algorithms.
Check whether your S/MIME/CMS stack supports ML-KEM in CMS.
Check whether your mail gateway, DLP, archiving, and legal hold tooling can process larger keys/signatures.
Check whether mobile clients can handle the chosen algorithms.
How to implement email/messaging PQC as an SRE
For enterprise email, treat it as three layers:
Layer
What to do
Transport
Enable TLS 1.3 and hybrid PQ KEX on SMTP/IMAP/submission endpoints where supported
Identity/authentication
Track PQ support for S/MIME certificates, DKIM, MTA-STS, DANE, internal PKI
Message content
Pilot PQ-capable OpenPGP or S/MIME/CMS for high-value groups
Do not assume that PQ TLS makes email fully quantum-safe. SMTP TLS protects the hop, not necessarily the message at rest or across every relay.
A sensible SRE rollout:
Upgrade mail edge TLS first.
Validate PQ-capable handshakes.
Keep classical compatibility.
Pilot content encryption for a small group.
Test archiving, search, DLP, legal hold, mobile clients, and recovery.
Build a clear policy for high-value long-lived content.
5. Cloud providers and enterprise platforms
Current support examples
AWS says hybrid post-quantum key agreement standards for TLS have been deployed to AWS KMS, AWS Certificate Manager, and AWS Secrets Manager endpoints, using ML-KEM for hybrid post-quantum key agreement in non-FIPS endpoints across AWS Regions in the aws partition. AWS also describes its work to provide a smooth migration to hybrid PQ key agreement for TLS.
Google Cloud documents post-quantum TLS support on load balancers using X25519MLKEM768.
Microsoft has made PQC capabilities available in Windows Insider builds and through SymCrypt-OpenSSL on Linux, exposing early-access support for testing.
Cloudflare documents PQ support for TLS 1.3-based protocols and Cloudflare IPsec support with hybrid ML-KEM.
What “enterprise platform support” actually means
For SREs, “cloud supports PQC” is too vague. You need to break it down:
Platform layer
PQC question
Public HTTPS edge
Does the load balancer/CDN negotiate hybrid PQ TLS?
Internal service mesh
Does mTLS support PQ/hybrid key exchange?
API clients/SDKs
Does the client TLS library support ML-KEM?
KMS/HSM
Does the service endpoint support hybrid PQ TLS?
Certificates
Are PQ or hybrid signatures supported?
Code signing
Are ML-DSA/SLH-DSA available?
VPN/interconnect
Does IPsec support hybrid ML-KEM?
Kubernetes ingress
Is the controller built with PQ-capable TLS?
Observability
Can negotiated crypto be measured?
Compliance
Is support available in FIPS mode or only non-FIPS?
A common trap: a cloud service may support hybrid PQ TLS on the public endpoint, but your client library, proxy, corporate TLS inspection device, or old Java runtime may prevent negotiation.
A TLS session might use hybrid PQ key exchange but still authenticate with an RSA or ECDSA certificate. That improves confidentiality against harvest-now, decrypt-later, but does not fully solve future authentication/signature risks.
TLS 1.2 is usually a blocker
Most practical web PQ KEX work is TLS 1.3-focused. Cloudflare explicitly documents PQ key agreements as TLS 1.3-based.
Middleboxes can break things
TLS inspection appliances, old proxies, old Java runtimes, IDS/IPS devices, and corporate gateways may not understand larger ClientHello messages or new groups.
Watch MTU and fragmentation
PQC handshakes are larger. This can matter in:
VPNs
mobile networks
IoT
old firewalls
UDP/QUIC
IPsec/IKE
FIPS mode may lag
Cloudflare notes PQ key agreements are disabled for websites in FIPS mode. Similar constraints may exist elsewhere. Always check whether PQC is supported in your compliance mode, not just in general product documentation.
SRE summary
For an SRE, PQC implementation is not “install a quantum-safe algorithm.” It is an estate-wide migration programme.
Your practical checklist is:
1. Inventory SSH, TLS, VPN, email, service mesh, PKI, KMS, CI/CD, and signing. 2. Find which systems support hybrid PQ key exchange. 3. Prove negotiation with logs or packet captures. 4. Enable hybrid PQ KEX at central termination points first. 5. Keep fallback for old clients, but measure fallback. 6. Add dashboards showing PQ-capable vs PQ-negotiated. 7. Test performance, MTU, rekeying, and rollback. 8. Track PQ signatures and certificate migration separately. 9. Push vendors for exact evidence, not marketing claims. 10. Prioritise systems carrying long-lived sensitive data.
The most useful near-term SRE target is:
Hybrid PQ key exchange for SSH, TLS 1.3, cloud load balancers, VPN tunnels, and high-value service endpoints — with observability proving what was actually negotiated.
This is one reason PQC migration is a platform engineering problem, not only a cryptography team problem.
Governments and critical infrastructure
Governments and critical infrastructure are planning migrations. For example, NSA’s CNSA 2.0 guidance sets out transition expectations for national security systems and quantum-resistant algorithms.
7 steps you can take now
Each step maps to a real migration programme.
Step 1: Inventory and discover
“Identify where cryptography is used across your systems, apps, and data.”
The goal is to verify the negotiated algorithm, not merely assume the software version supports it.
Step 4: Protect high-value data now
“Classify sensitive data. Use encryption, access controls, and monitoring.”
This is a risk-prioritisation step.
Not all systems need to move at the same speed. Prioritise data with:
long confidentiality lifetime
regulatory sensitivity
national security value
business-critical intellectual property
customer privacy impact
credential or root-of-trust value
For example:
High-priority data
Why
Health records
Sensitive for decades
Government records
Long-lived national/security implications
Source code and IP
Long-term commercial value
Root CA keys
Trust anchor compromise is catastrophic
Firmware signing keys
Device ecosystem compromise
Backups and archives
Often retained for years
Research data
May have long-term strategic value
This step should also include detection and monitoring. You need to know where sensitive data flows, where encrypted traffic terminates, and where long-lived keys exist.
Step 5: Plan for migration
“Follow NIST standards and your vendors’ roadmaps.”
This is the governance part.
A good PQC migration plan should include:
Workstream
Deliverable
Discovery
Crypto asset inventory
Risk
Data confidentiality lifetime assessment
Architecture
Hybrid/PQC target architecture
Dependencies
Vendor and library compatibility matrix
Testing
Lab validation and interoperability tests
Rollout
Phased migration by risk tier
Monitoring
Algorithm negotiation telemetry
Compliance
Mapping to NIST/sector requirements
Recovery
Rollback and downgrade prevention plan
NIST’s National Cybersecurity Center of Excellence has a migration-to-PQC project focused on practices for moving from quantum-vulnerable public-key algorithms to NIST-standardised PQC algorithms.
Step 6: Work with your ecosystem
“Engage vendors, partners, and customers.”
This is essential because cryptography is rarely isolated.
Your system may depend on:
operating system crypto policies
OpenSSL, BoringSSL, LibreSSL, GnuTLS, wolfSSL
Java crypto providers
HSM and KMS vendors
cloud load balancers
CDN providers
VPN appliances
endpoint agents
mobile clients
IoT devices
certificate authorities
browsers
package repositories
SaaS platforms
A company can be internally ready but still blocked by suppliers, old clients, embedded devices, or regulatory constraints.
The right questions for vendors are:
Which PQC algorithms do you support?
Do you support NIST FIPS 203/204/205?
Do you support hybrid key exchange?
Which protocols are supported: TLS, SSH, IPsec, S/MIME, code signing?
Is PQC enabled by default or opt-in?
What versions are required?
What telemetry shows negotiated algorithms?
What are the performance and packet-size impacts?
What is your roadmap for certificates and signatures?
Are HSM/KMS integrations supported?
Is there FIPS validation or planned validation?
Step 7: Stay informed and test
“Track standards and threats. Test PQC in labs and pilot environments.”
This is accurate because PQC is moving from standardisation into deployment. Standards exist, but production readiness varies across protocols, libraries, vendors, and operating systems.
Testing should include:
TLS handshake size and latency
SSH interoperability
certificate chain size
MTU and fragmentation issues
load balancer compatibility
packet inspection behaviour
HSM/KMS support
CPU overhead
memory impact
logging and observability
downgrade resistance
old client compatibility
disaster recovery and rollback
This is particularly important for SRE/platform teams because cryptographic changes can fail in operationally awkward places: old agents, old appliances, Java runtimes, embedded devices, package mirrors, monitoring agents, backup clients, and internal automation.
Clarification Points
“Cryptographically relevant quantum computers are not here yet.”
Quantum computers exist today, but not at the scale needed to break real-world RSA/ECC cryptography.
“Can break many widely used public-key algorithms.”
Quantum computers do not automatically break all classical cryptography. Symmetric encryption and hashes are affected differently.
PQC mainly replaces or augments public-key mechanisms:
key exchange
key encapsulation
digital signatures
Bulk encryption still normally uses symmetric encryption such as AES or ChaCha20.
The bottom line
Quantum computers will change the threat landscape. Post-quantum cryptography helps keep important data and communications secure for the future.
The practical message is:
Do not wait for a cryptographically relevant quantum computer to exist before starting migration.
The right approach is:
inventory cryptography
classify long-lived sensitive data
remove weak crypto now
test hybrid PQC where available
track NIST and vendor roadmaps
build crypto-agility
migrate high-value systems first
For infrastructure and SRE teams, PQC is not just “new algorithms”. It is a multi-year operational migration across SSH, TLS, VPNs, PKI, service identity, code signing, certificates, secrets management, observability, compliance, vendors, and customer compatibility.
“Neocloud” (sometimes written neo cloud) is a term for a new generation of cloud providers that specialize in AI computing rather than offering the full range of traditional cloud services. They focus heavily on providing high-performance GPUs for AI training and inference.
How neoclouds differ from traditional cloud providers
Traditional cloud (AWS, Azure, Google Cloud)
Neocloud
Broad range of services (databases, storage, networking, analytics, etc.)
Primarily focused on AI and GPU computing
Designed for many types of workloads
Optimized specifically for AI/ML workloads
Large hyperscale platforms
Often smaller, AI-focused companies
GPU capacity can be limited or expensive
Aim to provide faster access to GPUs and lower costs
Why neoclouds became popular
The explosion of generative AI created huge demand for GPUs such as NVIDIA H100 and Blackwell chips. Many organizations struggled to obtain enough AI compute from traditional cloud providers, creating an opportunity for specialized GPU cloud companies.
Examples of neocloud providers
Some well-known neocloud companies include:
CoreWeave
Lambda
Crusoe
Nebius
Together AI
These companies provide GPU-as-a-Service (GPUaaS) and AI-focused infrastructure.
Simple analogy
Think of traditional cloud providers as a large supermarket that sells everything, while a neocloud is a specialty store focused almost entirely on AI computing power. It may offer fewer services overall, but it is optimized for AI workloads and often provides better access to GPUs.
Nscale a European Neocloud?
Today, a more representative list of major neoclouds would include:
Company
Region
Notes
Nscale
UK / Europe
Full-stack AI infrastructure, sovereign AI cloud, GPU cloud, data centre developer.
CoreWeave
US
Often regarded as the archetypal neocloud.
Nebius
Europe
AI cloud and GPU infrastructure provider.
Lambda
US
GPU cloud focused on AI training and inference.
Crusoe
US
AI data centres and GPU cloud infrastructure.
Together AI
US
AI platform plus infrastructure.
Nscale’s positioning is actually slightly different from some of the others because it is trying to be vertically integrated:
Building or owning AI data centres.
Procuring GPU fleets at massive scale.
Operating AI cloud services.
Offering sovereign AI infrastructure for governments and enterprises.
Running full-stack AI platforms rather than just renting GPUs.
Some analysts now classify Nscale as an AI hyperscaler rather than merely a neocloud because of the scale it is targeting. ABI Research ranked Nscale as the overall leader among 14 neocloud providers in its 2026 assessment.
What’s interesting is that the neocloud landscape appears to be splitting into three tiers:
AI hyperscalers – own data centres, networking, power, GPUs, and cloud platform.
Nscale is deliberately pursuing category 3. The company describes itself as a vertically integrated AI cloud and has announced very large-scale deployments in Europe and the US.
If you compare Nscale, CoreWeave, and Crusoe specifically, I’d place them like this:
Area
Nscale
CoreWeave
Crusoe
Sovereign European AI
Strongest
Limited
Limited
GPU Cloud
Strong
Very Strong
Strong
Data Centre Ownership
Extensive strategy
Growing
Extensive
AI Hyperscaler Ambition
Very High
High
High
European Presence
Strongest
Moderate
Moderate
Microsoft Partnerships
Significant
Significant
Significant
From a European perspective, Nscale is probably the closest thing Europe currently has to a home-grown AI hyperscaler.
No. If we’re talking about Europe specifically, I would actually argue the opposite:
CoreWeave is currently ahead in deployed AI infrastructure, while Nscale is ahead in announced future European capacity.
Those are very different things.
CoreWeave’s position in Europe
CoreWeave already has:
European headquarters in London.
Two operational UK data centres.
Expansion into Norway, Sweden, and Spain.
Billions already committed and deployed into European infrastructure.
A mature GPU cloud platform that is already serving customers globally.
By 2025, CoreWeave had announced European expansion into Norway, Sweden, and Spain alongside its existing UK footprint.
More importantly, CoreWeave entered Europe after already becoming a large-scale AI cloud provider in the US. They brought:
Operational expertise
Existing customers
Existing software platform
Existing GPU fleet
That is a major advantage.
Where Nscale is stronger
Nscale’s strength is the future build pipeline.
Publicly announced projects include:
Stargate Norway
Sines (Portugal)
UK AI campus developments
Iceland expansion plans
Some of these projects are absolutely enormous on paper. The Norway Stargate project alone targets 100,000 NVIDIA GPUs.
Portugal is also positioned as one of Nscale’s flagship European hubs, with 12,600+ Blackwell GPUs initially and much larger Rubin deployments planned later.
The key distinction
If you compare today’s operational reality:
Metric
CoreWeave
Nscale
Operational GPU cloud
Ahead
Behind
Existing customer workloads
Ahead
Behind
Software/cloud platform maturity
Ahead
Behind
European operational experience
Ahead
Behind
Publicly visible deployed GPU capacity
Ahead
Behind
If you compare future announced European capacity:
Metric
CoreWeave
Nscale
Norway buildout
Large
Very large
Portugal
Limited public presence
Major flagship site
Sovereign AI initiatives
Some
Strong focus
OpenAI-linked projects
Limited
Significant
Future European MW pipeline
Large
Potentially larger
A useful analogy
Today, CoreWeave is closer to:
“We already run a large AI cloud and are expanding into Europe.”
Nscale is closer to:
“We are building some of Europe’s largest AI campuses and will become a major AI cloud.”
Those are different stages of maturity.
The question investors are asking
The debate isn’t really:
“Can Nscale catch CoreWeave?”
The debate is:
“Can Nscale turn announced power, land, and GPU commitments into revenue-producing clusters before demand or financing conditions change?”
CoreWeave has already demonstrated it can operate large GPU fleets and monetize them. Nscale is in the process of proving that at the same scale.
One interesting point: some recent reporting has questioned the extent to which both companies’ European investment announcements translate into immediately operational facilities, noting that some “new data centre” claims are actually deployments into existing colocation facilities rather than brand-new campuses. That criticism has been directed at both Nscale and CoreWeave.
So as of mid-2026:
Operationally: CoreWeave is ahead in Europe.
Announced future European capacity: Nscale may have the larger headline pipeline.
Execution risk: Nscale has more to prove because a larger proportion of its European footprint is still future-dated.
Is Nscale’s IPO still on target for late 2026?
As of June 2026, there is no publicly filed prospectus, no announced exchange, and no confirmed IPO date for Nscale.
The strongest public indication that an IPO is still being pursued comes from industry reports stating that Nscale was planning a fall/late-2026 IPO and was pursuing additional US data-centre acquisitions ahead of that listing.
However, there are several reasons to be cautious about assuming it is “on target”:
Reasons it could still happen in late 2026
The AI infrastructure sector remains one of the hottest areas in public markets.
Investors have rewarded AI infrastructure companies such as CoreWeave since its public debut.
Nscale has announced very large infrastructure commitments involving Microsoft and multiple multi-hundred-megawatt campuses, which is the type of growth story public investors currently like.
Reasons it could slip into 2027
The challenge is that public-market investors increasingly want proof of:
Revenue growth
Actual GPU deployments
Utilization rates
Long-term customer contracts
Cash-flow visibility
rather than just power agreements and future construction plans.
Unlike CoreWeave, which entered public markets after operating large GPU fleets for years, much of Nscale’s most ambitious capacity remains future-dated. That creates execution risk that investors will scrutinize heavily.
What I would watch for
If Nscale is genuinely targeting a late-2026 IPO, I would expect to see during the next few months:
Appointment of lead underwriters (Goldman Sachs, Morgan Stanley, JPMorgan, etc.).
Public filing activity or confidential filing reports.
More detailed revenue disclosures.
Announcements of operational GPU deployments, not just planned deployments.
Additional long-term customer agreements.
My assessment
If I had to assign probabilities today:
Outcome
Probability
IPO in Q4 2026
~40%
IPO slips into H1 2027
~45%
IPO delayed beyond 2027
~15%
That’s not based on any insider information—just on where Nscale appears to be in its infrastructure rollout compared with where most AI infrastructure companies are when they ring the bell.
The most important signal is not the IPO date itself. It’s whether Nscale can demonstrate that its Norway, Texas, Portugal, and future UK capacity are being converted into revenue-generating GPU clusters with high utilization. If that evidence emerges during 2026, a late-2026 IPO becomes much more plausible.
CoreWeave
CoreWeave is an AI cloud provider that specializes in delivering large-scale GPU infrastructure for AI training, inference, HPC, rendering, and scientific computing.
The company started life as a GPU-focused cloud provider and has evolved into one of the largest independent AI infrastructure companies in the world.
Unlike AWS, Azure, and Google Cloud, which offer AI as part of a broader cloud portfolio, CoreWeave is almost entirely focused on GPU-accelerated workloads.
Category
Details
Founded
2017
Headquarters
Roseland, New Jersey, USA
Focus
AI Cloud Infrastructure
Primary Business
GPU-as-a-Service
Main Customers
OpenAI, Microsoft, NVIDIA ecosystem, AI startups
Major Hardware
NVIDIA H100, H200, GB200, Blackwell
Competitors
AWS, Azure, Google Cloud, Crusoe, Lambda, Nscale
How CoreWeave Started
The company originally operated in cryptocurrency mining.
Management realized early that:
GPUs used for mining
GPUs used for AI training
GPUs used for rendering
all required similar infrastructure.
When the AI boom began following the success of ChatGPT, CoreWeave pivoted aggressively into AI compute.
This turned out to be one of the best-timed pivots in the technology industry.
CoreWeave’s Business Model
Think of CoreWeave as:
NVIDIA ↓ CoreWeave ↓ AI Companies
Instead of:
NVIDIA ↓ Microsoft Azure AWS Google Cloud ↓ AI Companies
CoreWeave sits between NVIDIA and AI customers.
What Services Does CoreWeave Offer?
1. AI Training Clusters
Used for:
Large Language Models (LLMs)
Foundation Models
Multimodal Models
Scientific AI
Examples:
GPT-style models
Image generation models
Robotics models
Typical infrastructure:
Thousands of GPUs
InfiniBand networking
Petabytes of storage
2. AI Inference
After a model is trained:
Training ↓ Model ↓ Inference
Inference is what happens when:
You ask ChatGPT a question
Generate an image
Run a chatbot
CoreWeave provides infrastructure for this at scale.
3. HPC
High Performance Computing workloads:
Weather modelling
Genomics
Drug discovery
CFD
Physics simulations
This is an area where CoreWeave competes with traditional HPC centres.
4. GPU Cloud
Instead of buying:
H100s
H200s
Blackwell systems
Customers rent them by:
Hour
Day
Month
Why NVIDIA Likes CoreWeave
NVIDIA has invested in CoreWeave because CoreWeave helps NVIDIA:
By 2026, CoreWeave is operating or building infrastructure measured in:
Hundreds of thousands of GPUs
Multiple gigawatts of power
Dozens of AI data centres
This puts them among the largest AI-focused cloud providers globally.
Why Microsoft Matters
One of CoreWeave’s biggest customers has been Microsoft.
Microsoft has used CoreWeave capacity to supplement Azure AI infrastructure when Azure could not provision GPUs quickly enough.
This relationship helped accelerate CoreWeave’s growth enormously.
CoreWeave vs Nscale
Area
CoreWeave
Nscale
Founded
2017
2024
Stage
Mature AI cloud
Emerging AI hyperscaler
GPUs Deployed Today
Very Large
More Limited
Revenue
Much Higher
Earlier Growth
Operational Experience
Extensive
Building
US Presence
Major
Growing
Europe Presence
Growing
Large Future Pipeline
Data Centres
Operating Today
Many Future Builds
AI Cloud Platform
Mature
Developing
What Would Interest an SRE?
For someone coming from:
Kubernetes
Observability
OpenTelemetry
Prometheus
Mimir
Loki
Tempo
HPC
CoreWeave is fascinating because it combines:
Infrastructure Scale
Thousands of servers per cluster.
AI Networking
InfiniBand
RoCE
GPUDirect RDMA
Storage
High-throughput parallel storage
Object storage
Checkpointing
Reliability
When a training run consumes:
10,000 GPUs × 7 days
a single infrastructure failure can cost millions of dollars.
This creates unique SRE challenges around:
Cluster reliability
GPU scheduling
Capacity management
Fleet automation
Telemetry at hyperscale
AI workload observability
Why CoreWeave is Important
CoreWeave is one of the first companies to prove that a specialist AI cloud provider can compete with traditional hyperscalers.
The company effectively created a new category:
Traditional Cloud AWS Azure GCP
vs
AI Cloud CoreWeave Crusoe Lambda Nscale
That category is now one of the fastest-growing areas of infrastructure technology and is driving much of the current AI infrastructure build-out worldwide.
CoreWeave’s stock has had one of the most volatile post-IPO journeys in the AI infrastructure sector.
Share Price Since IPO
CoreWeave completed its Nasdaq IPO in March 2025 under the ticker CRWV. The IPO was downsized before launch, raising about $1.5 billion rather than the larger amount initially targeted.
The broad trajectory has been:
Period
Approximate Story
Mar 2025 IPO
Weak initial reception and downsized offering
Apr–Jun 2025
Strong AI enthusiasm drove shares sharply higher
Jun 2025
Reached all-time highs around $187/share
H2 2025
Significant correction as investors focused on debt, losses, and data-centre execution
Early 2026
Recovery driven by AI demand, Anthropic, Meta, OpenAI and enterprise growth
Jun 2026
Trading around $107/share
Recent trading puts the company at a market capitalization of roughly $56 billion.
The Good News Financially
Revenue Growth Is Extraordinary
CoreWeave is one of the fastest-growing infrastructure companies in the market.
Examples include:
Revenue more than doubled year-over-year in multiple recent quarters.
Enterprise adoption is expanding beyond AI labs into financial services and large enterprises.
Revenue backlog reached approximately $99.4 billion as of Q1 2026.
That backlog is enormous and provides strong visibility into future revenue.
Recent earnings showed revenue beating expectations while margins and profitability remained under pressure.
Customer Concentration
Historically, a large portion of revenue has come from a relatively small number of customers.
If:
OpenAI
Microsoft
Meta
Anthropic
decide to build more capacity themselves, future growth could be affected.
This is one reason investors closely watch customer mix and backlog growth.
Why Investors Still Like It
The bullish thesis is straightforward:
AI demand continues growing.
GPU supply remains constrained.
Training and inference workloads keep increasing.
CoreWeave owns and operates the infrastructure needed to satisfy that demand.
In that scenario, today’s debt becomes manageable because revenue grows faster than financing costs.
Compared with Nscale
If I compare the two today:
Area
CoreWeave
Nscale
Public Company
Yes
Not yet
Market Cap
~$56B
Private
Revenue
Multi-billion
Much smaller
Operational GPU Capacity
Very large
Limited publicly visible
Revenue Backlog
~$99B
Not publicly disclosed at same level
Debt
Very high
Much lower today
Execution Risk
Moderate
High
Infrastructure Maturity
Established
Emerging
CoreWeave’s biggest challenge is financial leverage.
Nscale’s biggest challenge is execution.
CoreWeave has already proven it can build and operate AI infrastructure at scale. The question investors are asking is whether it can generate enough cash flow to justify the enormous capital expenditure and debt required to stay ahead in the AI compute race.
Crusoe
Crusoe is arguably the third major AI infrastructure challenger behind CoreWeave and the large hyperscalers, and alongside Nscale and Radiant in the race to build AI factories.
What makes Crusoe unique is that it evolved from an energy company into an AI infrastructure company.
Its progression has been roughly:
Flared Gas Capture ↓ Power Generation ↓ Bitcoin Mining ↓ GPU Infrastructure ↓ AI Cloud ↓ AI Factories
Today the company describes itself as an “AI Factory Company” rather than a traditional cloud provider.
Current Position
Valuation
Crusoe raised:
$600M Series D (2024)
$1.375B Series E (2025)
at a valuation exceeding $10 billion.
There are also industry reports suggesting private-market discussions at significantly higher valuations during 2026, though these are not official company figures.
Funding Strength
Crusoe has now raised approximately:
$3.8B+ equity funding
Additional billions in project finance and credit facilities
including a $750M Brookfield-backed credit facility.
Compared with many startups, Crusoe has become exceptionally well capitalized.
The Abilene AI Campus
The company’s flagship project is:
Abilene, Texas
This has become one of the largest AI infrastructure projects in the world.
Public reports describe:
1.2 GW campus
Up to ~400,000 NVIDIA GB200-class GPUs planned
$15B+ joint venture funding
Major Oracle/OpenAI involvement
Multiple operational buildings already online
This campus is one of the key foundations of the Stargate ecosystem.
Relationship With OpenAI, Oracle & Microsoft
Crusoe sits at the center of a fascinating triangle:
OpenAI │ Oracle │ Crusoe │ Microsoft
Recent developments have been mixed:
Positive
Oracle states:
Abilene remains on schedule
Two buildings are operational
Additional Stargate capacity remains under development
Complicated
Several planned expansions have changed tenants or scope.
Reports indicate:
OpenAI and Oracle stepped back from some expansion plans.
Microsoft subsequently agreed to lease part of the adjacent capacity.
Meta has reportedly evaluated some available capacity.
This isn’t necessarily bad news—it may actually demonstrate that demand is broad enough that multiple hyperscalers are competing for capacity.
Revenue Performance
Industry estimates suggest:
Year
Revenue
2024
~$276M
2025
~$998M
2026
Potentially >$2B
These are not audited public-company figures but are widely cited estimates reflecting the company’s rapid growth trajectory.
If accurate, Crusoe would be among the fastest-growing infrastructure companies globally.
Why Investors Like Crusoe
1. Speed
Crusoe has developed a reputation for building AI infrastructure extremely quickly.
Some investors explicitly cite build speed as a competitive advantage versus traditional data-center developers.
2. Vertical Integration
Unlike many competitors, Crusoe controls:
Power ↓ Generation ↓ Infrastructure ↓ Data Centres ↓ GPU Cloud
This resembles Radiant’s strategy and increasingly resembles Nscale’s.
3. AI Factory Focus
The company is moving beyond:
GPU Rental
toward:
Complete AI Factories
which is where the largest contracts are emerging.
Current Challenges
1. Customer Concentration
Much of Crusoe’s growth is tied to:
OpenAI
Oracle
Microsoft
This creates concentration risk.
If one customer changes strategy, large projects can be affected.
2. Capital Intensity
Like CoreWeave, Crusoe requires enormous capital expenditures.
Building:
Multi-GW campuses
Power infrastructure
GPU fleets
requires tens of billions of dollars.
3. Project Volatility
Recent examples include:
Wyoming project pause
Changing Stargate scope
Customer reallocations between OpenAI, Oracle, Microsoft and others
This demonstrates that even the hottest AI infrastructure projects are not immune to execution risk.
How Crusoe Compares
Category
CoreWeave
Crusoe
Nscale
Radiant
Public Company
Yes
No
No
No
Valuation
~$56B market cap
$10B+ private
Private
Private
AI Cloud Platform
Mature
Growing rapidly
Emerging
Ori platform
Operational AI Infrastructure
Very large
Large
Smaller today
Early
AI Factory Focus
Strong
Very strong
Very strong
Very strong
Energy Integration
Moderate
Strong
Strong
Exceptional
IPO Candidate
Already public
Likely future IPO
Potential IPO
Long-term possibility
What I Think of Crusoe
Among the “new hyperscalers”:
CoreWeave is currently the operational leader.
Crusoe is probably the most advanced private AI infrastructure company.
Nscale has one of the largest future pipelines.
Radiant may have the strongest long-term capital structure because of Brookfield.
Crusoe’s biggest strength is that it has already proven it can deliver and operate very large AI campuses while still retaining startup-level speed. Its biggest challenge is moving from a few gigantic flagship projects into a diversified, repeatable AI infrastructure business that is less dependent on any single customer or project.
CoreWeave vs Crusoe vs Nscale
These are arguably the three most important “Neoclouds” today.
All three are trying to become the AI-era equivalent of hyperscalers, but they are taking very different paths.
Executive Summary
Company
CoreWeave
Crusoe
Nscale
Founded
2017
2018
2024
Status
Public company
Large private company
Large private company
Core Identity
AI cloud provider
AI factory builder
AI infrastructure hyperscaler
Geographic Strength
US
US
Europe
Operational Maturity
Highest
High
Emerging
AI Cloud Platform
Most mature
Growing
Developing
Energy Ownership
Limited
Strong
Strong
Future Capacity Pipeline
Large
Very Large
Enormous
Biggest Risk
Debt
Customer concentration
Execution
Biggest Strength
Operational excellence
Infrastructure delivery
Power + future capacity
CoreWeave is currently winning on execution. Crusoe is winning on AI factory construction. Nscale is winning on future infrastructure ambition.
1. CoreWeave
What CoreWeave Is
CoreWeave is fundamentally an AI-native cloud provider.
Think:
AWS for GPUs
except purpose-built for:
AI training
AI inference
LLMs
HPC
Its cloud platform is already mature and heavily used by large AI companies. CoreWeave operates dozens of data centres, hundreds of thousands of GPUs, and has become one of NVIDIA’s most important cloud partners.
CoreWeave reported more than $5B revenue and a backlog approaching $67B-$88B depending on reporting period.
Weaknesses
Huge debt load
Heavy capex requirements
Customer concentration
Public market scrutiny
2. Crusoe
What Crusoe Is
Crusoe is best described as:
Energy Company + AI Factory Builder + GPU Cloud
It started by monetizing stranded energy and evolved into building some of the largest AI campuses in the world.
The Abilene campus in Texas has become one of the flagship AI infrastructure projects globally and is tied to Oracle and OpenAI’s broader Stargate ecosystem.
Strengths
Extremely fast construction capability
Strong energy expertise
Large-scale AI factory delivery
Deep OpenAI/Oracle ecosystem integration
Weaknesses
Smaller cloud platform than CoreWeave
Less diversified customer base
Still heavily tied to a few mega-projects
What Crusoe Wants To Become
Crusoe appears to be evolving toward:
AI Factory Company
rather than simply a GPU cloud.
3. Nscale
What Nscale Is
Nscale is pursuing the most ambitious infrastructure vision.
Their strategy is:
Power ↓ Land ↓ Data Centres ↓ GPUs ↓ Cloud Platform
They are effectively trying to build a European AI hyperscaler from scratch.
Strengths
Massive future pipeline
Strong sovereign AI positioning
European leadership position
Large power commitments
Strong Microsoft/OpenAI/NVIDIA relationships
Weaknesses
Much of capacity remains future-dated
Less operational experience
Less mature cloud platform
Execution risk
Public reporting has highlighted that several headline projects remain in buildout or planning phases rather than being fully operational today.
The Strategic Difference
CoreWeave
Started with:
GPUs
Then added:
Cloud → Data Centres → Power
Crusoe
Started with:
Energy
Then added:
Data Centres → GPUs → AI Factories
Nscale
Started with:
Power + Infrastructure
Then added:
GPUs → Cloud → Sovereign AI
Which Company Is Furthest Ahead Today?
Operational AI Cloud
Winner:
🥇 CoreWeave
Reason:
Largest operational fleet
Most mature software platform
Largest customer base
AI Factory Construction
Winner:
🥇 Crusoe
Reason:
Abilene
Stargate involvement
Proven delivery capability
Future Capacity Pipeline
Winner:
🥇 Nscale
Reason:
Norway
Portugal
Texas
UK projects
Sovereign AI initiatives
Which Is Closest To Becoming a New Hyperscaler?
Today
CoreWeave ↑ | Crusoe | Nscale
By 2030 (Potential)
CoreWeave Crusoe Nscale
All three could be major AI infrastructure providers, but they will likely specialize differently:
Company
Likely Long-Term Identity
CoreWeave
AI Cloud Hyperscaler
Crusoe
AI Factory & Energy Infrastructure Leader
Nscale
Sovereign AI & European AI Hyperscaler
From an SRE / Cloud Infrastructure Perspective
If you wanted to work on the most technically mature environment today:
CoreWeave
If you wanted to build some of the world’s largest AI campuses:
Crusoe
If you wanted to help create a new AI hyperscaler from the ground up:
Nscale
That is the clearest distinction between the three companies as of mid-2026.
Who is Radiant?
Radiant/Ori is one of the more interesting challengers because they are not trying to copy CoreWeave or Nscale exactly.
Instead, they are attempting to combine:
Brookfield’s enormous infrastructure and energy assets
Ori’s AI cloud software platform
NVIDIA’s AI factory ecosystem
Sovereign AI demand from governments and large enterprises
into a vertically integrated AI infrastructure company.
What is Ori?
Before the merger, Ori Industries was a UK AI cloud company founded in 2019.
Ori built:
Distributed GPU cloud infrastructure
AI model training platforms
AI deployment services
Multi-location AI compute services
The company operated AI infrastructure across more than 20 global locations and developed software to orchestrate AI workloads across GPU infrastructure.
Think of Ori as:
What CoreWeave built: GPU Cloud Platform
What Ori built: Distributed AI Infrastructure Platform
Ori’s technology is arguably the key intellectual property in the merger.
What is Radiant?
Radiant is Brookfield’s AI infrastructure company.
Brookfield is one of the world’s largest infrastructure investors with hundreds of billions under management spanning:
Power generation
Transmission
Renewable energy
Real estate
Data centres
Infrastructure projects
Radiant was created to become Brookfield’s AI compute platform.
Why Brookfield Matters
This is where Radiant becomes potentially disruptive.
Most AI clouds have a structure like:
Raise Venture Capital ↓ Buy GPUs ↓ Rent Datacentre Space ↓ Sell Compute
CoreWeave largely grew this way.
Nscale is evolving toward:
Power ↓ Datacentres ↓ GPUs ↓ Cloud Platform
Radiant starts with:
Brookfield Capital + Brookfield Power + Brookfield Land + Brookfield Datacentres + Ori Software
That means they potentially have access to cheaper capital than most AI startups.
Their Stated Strategy
Radiant has publicly described itself as a vertically integrated AI infrastructure platform.
Target customers include:
Sovereign governments
Hyperscalers
Tier-1 telecom operators
Large enterprises
Rather than simply renting GPUs to startups.
Their focus appears to be:
AI Factories
Large installations of:
NVIDIA GPUs
AI networking
AI storage
AI orchestration software
built for nations and large corporations.
The NVIDIA Connection
Radiant is built around NVIDIA’s AI factory vision.
Public statements indicate:
NVIDIA contributed capital to Brookfield’s AI fund.
NVIDIA will supply GPUs.
Radiant will deploy NVIDIA DSX AI factories.
This places them squarely in the same ecosystem as:
CoreWeave
Crusoe
Lambda
Nscale
but with a heavier focus on sovereign infrastructure.
How They Intend to Join the Hyperscaler Club
The strategy appears to be:
Phase 1: Acquire Software
Acquire Ori.
Result:
GPU Cloud Software AI Orchestration AI Platform Expertise
✓ Completed.
Phase 2: Leverage Brookfield Infrastructure
Use Brookfield’s:
powered land
data centres
energy assets
instead of building everything from scratch.
This is a major advantage versus startups.
Phase 3: Build Sovereign AI Factories
Target:
governments
national AI initiatives
regulated industries
This aligns well with Europe’s push toward sovereign AI and AI factories.
Phase 4: Scale Like a Utility
This is probably the most important difference.
Several executives have stated they want AI infrastructure financed like:
Power Stations Utilities Rail Networks Airports
rather than venture-backed cloud startups.
That could significantly lower financing costs compared with many GPU cloud providers.
How Do They Compare?
Company
CoreWeave
Nscale
Radiant
Founded
2017
2024
2026
Public
Yes
No
No
Core Strength
Operating GPU clouds
Building AI campuses
Infrastructure + software
Main Backer
Public markets
Investors/NVIDIA
Brookfield
Focus
AI cloud
AI hyperscaler
AI utility model
Sovereign AI
Moderate
Strong
Very Strong
Capital Access
Good
Good
Potentially Exceptional
Operational GPU Scale Today
Highest
Lower
Very Early
What Could Make Radiant Dangerous?
If you look at this as an SRE or infrastructure engineer, the biggest threat to competitors is not technology.
It is cost of capital.
CoreWeave’s biggest weakness is debt.
Nscale’s biggest challenge is execution.
Radiant’s pitch is:
“We already own the power, land, infrastructure financing, and data-centre expertise. We just needed the AI cloud software.”
That is precisely what the Ori acquisition gives them.
If Brookfield genuinely deploys the AI Infrastructure Fund at the scale discussed publicly (up to $10B fund commitments and potentially much larger through co-investment structures), Radiant could become one of the few companies capable of competing with CoreWeave, Nscale, Crusoe, and the hyperscalers in the sovereign AI factory market.
For someone with a background in Kubernetes, OpenStack, HPC, AI infrastructure, observability, Ceph, Slurm, and GPU platforms, Radiant is arguably one of the most interesting companies to watch over the next 2–3 years because they are trying to build the “AI utility company” rather than just another GPU cloud.
Is Radiant Ramping Up Recruitment?
If I were advising Radiant’s leadership after the Brookfield + Ori merger, I would not primarily hire more software developers or more data-centre staff initially.
The biggest challenge is integrating:
Energy Infrastructure + Data Centres + GPU Factories + Cloud Platform + Sovereign AI
These are the people that actually make expensive GPUs productive.
3. Staff Network Engineers
Need 20–40.
The AI industry is becoming:
Network Limited rather than GPU Limited
Experience:
InfiniBand
RoCE
EVPN/VXLAN
Arista
NVIDIA Spectrum
Mellanox
Sources:
Meta
Microsoft
NVIDIA
Oracle OCI
Azure
4. Site Reliability Engineers
Need 30–60.
Not generic web SREs.
Need:
Kubernetes
Linux
GPU clusters
Storage
Automation
Focus:
Reliability Capacity Performance Automation
5. Observability Platform Engineers
Need 10–20.
This is where many AI companies are currently weak.
Technology:
OpenTelemetry
Prometheus
Mimir
Loki
Tempo
ClickHouse
Kafka
Mission:
Observe Everything
including:
GPUs
Power
Cooling
Storage
Training jobs
Networks
This is one of the areas where someone with your background would be valuable.
Tier 2 — Build During Year One
6. OpenStack Engineers
Many sovereign customers still want:
Private Cloud
rather than:
Public GPU Cloud
Need:
Nova
Neutron
Cinder
Ironic
Especially for government customers.
7. Storage Engineers
Need 15–30.
Experience:
Ceph
Lustre
BeeGFS
Weka
VAST
AI clusters consume storage at enormous scale.
8. Infrastructure Software Engineers
Need 20–50.
Build:
Fleet management
Provisioning
Capacity systems
Internal developer platforms
Languages:
Go
Python
Rust
9. Platform Security Engineers
Need 10–20.
Focus:
Supply chain security
GPU isolation
Sovereign compliance
Zero trust
Tier 3 — The Secret Weapon
These are the hires that separate a cloud provider from an AI hyperscaler.
10. HPC Engineers
Need 20–40.
Backgrounds:
National labs
Universities
Supercomputing centres
Skills:
Slurm
MPI
InfiniBand
Parallel filesystems
These people understand:
10,000 GPU training jobs
better than most cloud engineers.
11. Power Systems Engineers
This is where Brookfield can dominate.
Need:
Utility engineers
Grid engineers
High-voltage engineers
Most AI companies have very few.
Brookfield already has many.
Radiant should integrate them directly.
12. Cooling Engineers
Future AI factories may be:
100MW+ 500MW+ 1GW+
Cooling becomes strategic.
Need expertise in:
Liquid cooling
Direct-to-chip
Immersion
The Leadership Layer
Radiant’s biggest risk is organizational silos.
Avoid:
Brookfield Team | | Ori Team
Instead build:
AI Infrastructure | +-- Energy +-- Datacentres +-- GPU Platform +-- SRE +-- Observability +-- Security
If I Had £100M Hiring Budget
I’d prioritize:
Role
Approx Headcount
GPU Platform Engineers
40
SREs
40
Network Engineers
30
Infrastructure Software Engineers
30
Storage Engineers
20
Observability Engineers
15
HPC Engineers
20
Security Engineers
15
AI Infrastructure Architects
10
Power/Cooling Specialists
20
Total: ~240 specialist engineers.
The Three Most Valuable Hires
If Radiant could only hire three categories tomorrow:
Principal GPU Platform Engineers
Principal AI Networking Engineers
Principal Observability/SRE Engineers
Those three groups determine whether a 100,000-GPU AI factory operates at:
95% utilization
or
60% utilization
The difference is potentially hundreds of millions of dollars per year in infrastructure efficiency. For a company trying to become an AI utility, those engineering disciplines are arguably more important than almost any other technical hiring category.
Oracle’s Journey
Phase 1: Database Company (1977-2010)
For decades Oracle was essentially:
Databases + Enterprise Software
Revenue came from:
Oracle Database
Enterprise applications
Middleware
Support contracts
Oracle dominated enterprise IT but missed the early public cloud wave.
Phase 2: Late Cloud Entrant (2010-2020)
AWS, Azure and Google Cloud were already well established.
Oracle’s first cloud attempts struggled because they largely tried to:
Move Oracle Products ↓ Into Oracle Cloud
rather than building a cloud-native platform.
OCI v1 wasn’t competitive.
Phase 3: OCI Rebuild (2018-2024)
This is where Oracle changed direction.
Under Clay Magouyrk’s leadership, OCI was essentially rebuilt from scratch.
Key design decisions:
Bare Metal First
Unlike AWS:
Physical Server ↓ Hypervisor ↓ VM
OCI emphasized:
Physical Server ↓ Customer
This became attractive for:
HPC
AI
Databases
RDMA Networking
Oracle invested heavily in:
RoCE
RDMA
HPC fabrics
Years before AI made these mainstream.
This is one reason OCI became attractive for GPU clusters.
Autonomous Infrastructure
OCI automated large parts of:
provisioning
patching
operations
allowing Oracle to run cloud regions with fewer people.
Phase 4: AI Pivot (2023-Present)
ChatGPT changed everything.
Oracle suddenly found that:
Their Strengths Were AI Strengths
They already had:
✓ Bare metal
✓ HPC networking
✓ RDMA
✓ Large data centres
✓ Enterprise customers
These are exactly what AI workloads need.
The OpenAI Relationship
This is where Oracle became a serious AI player.
Oracle started providing infrastructure for:
OpenAI
Microsoft
Stargate
through extremely large GPU deployments.
Oracle is now one of the biggest buyers of NVIDIA GPUs in the world.
Oracle’s AI Infrastructure Today
Oracle is building:
GB200 Clusters
Blackwell Clusters
RoCE Fabrics
AI Superclusters
At a scale that rivals many neoclouds.
Some deployments involve:
10,000+ 50,000+ 100,000+ GPUs
depending on project.
Why Oracle Is Different From CoreWeave
CoreWeave started with:
GPUs ↓ Cloud
Oracle started with:
Cloud ↓ GPUs
This gives Oracle advantages.
Existing Customers
Oracle already has:
banks
governments
telecoms
healthcare
These customers are now buying AI services.
CoreWeave must acquire those customers.
Oracle already has them.
Existing Revenue
Oracle generates tens of billions annually.
This means they can fund AI expansion from operating cash flow.
CoreWeave relies more heavily on:
debt
equity
project financing
Existing Global Footprint
OCI already operates dozens of regions.
Nscale and Crusoe are still building much of theirs.
Is Oracle Becoming a Hyperscaler?
Oracle already is one.
OCI is generally considered the fourth major hyperscaler after:
AWS
Azure
Google
Oracle
The question is really:
Is Oracle becoming an AI hyperscaler?
The answer is:
Yes.
Is Oracle Becoming a Neocloud?
Not really.
Neoclouds are generally:
AI First
Examples:
CoreWeave
Crusoe
Nscale
Radiant
Oracle is:
Cloud First ↓ AI Enhanced
A different origin story.
What Oracle Is Morphing Into
I would describe Oracle as:
Traditional Hyperscaler + AI Factory Operator + GPU Supercluster Provider
In fact Oracle increasingly resembles:
AWS + CoreWeave
combined.
AWS scale.
CoreWeave-style GPU infrastructure.
Why This Matters for the AI Race
The biggest threat to CoreWeave, Nscale and Crusoe may not be each other.
It may be Oracle.
Because Oracle has:
✓ Existing cloud
✓ Existing customers
✓ Existing revenue
✓ Existing data centres
✓ Existing support organisation
✓ Existing enterprise sales force
✓ Massive GPU procurement
The neoclouds must build these capabilities.
Oracle already has them.
The Next 5 Years
If current trends continue:
Company
Likely Position 2030
AWS
Largest general cloud
Azure
Largest enterprise AI cloud
Google
AI + data platform leader
Oracle
AI infrastructure hyperscaler
CoreWeave
Largest independent AI cloud
Crusoe
AI factory leader
Nscale
Sovereign AI hyperscaler
Radiant
AI utility platform
My view is that Oracle is not becoming a neocloud.
Instead, Oracle is doing something arguably more powerful:
It is transforming from a traditional hyperscaler into an AI hyperscaler while retaining all the advantages of an established cloud provider.
That combination of existing scale, enterprise relationships, and AI infrastructure investment is why Oracle has suddenly become one of the most important players in the AI infrastructure market.
Is Oracle the opposite of Radiant and vice versa?
Not exactly, but they are surprisingly close to being mirror images of each other.
If you look at their origins:
Oracle
Radiant
Started with software
Started with infrastructure
Database company
Infrastructure company
Built cloud platform
Acquired cloud platform (Ori)
Added AI later
Added AI from day one
Enterprise customers first
Sovereign AI first
Compute-centric
Power-centric
Cloud → AI
Infrastructure → AI
A useful way to think about it is:
Oracle ------- Software ↓ Database ↓ Cloud ↓ AI Infrastructure
Radiant -------- Infrastructure ↓ Power ↓ Data Centres ↓ AI Infrastructure
So they are converging on a similar destination from opposite directions.
Oracle’s DNA
Oracle fundamentally thinks like a software company.
Radiant fundamentally thinks like an infrastructure company.
Its worldview is:
Power ↓ Land ↓ Data Centre ↓ GPU Factory ↓ AI Services
Its biggest assets are:
Brookfield capital
Brookfield power
Brookfield real estate
Brookfield infrastructure expertise
Ori’s AI platform
Radiant asks:
“How do we build the infrastructure that powers AI?”
The Biggest Difference
Oracle’s bottleneck is usually:
Customer Demand
They already have:
Data centres
Customers
Revenue
They need more GPUs and power.
Radiant’s bottleneck is usually:
Software & Customer Acquisition
They already have:
Capital
Infrastructure expertise
Energy
They need:
AI cloud adoption
Enterprise relationships
Platform scale
What They Are Trying To Become
Oracle is evolving toward:
AI Hyperscaler
Radiant is evolving toward:
AI Utility
Those are related but different.
Oracle Vision
Oracle Cloud + AI Superclusters + Enterprise AI
Think:
“AWS/Azure with massive AI capability.”
Radiant Vision
Power + Data Centres + AI Factories + Long-term Infrastructure Contracts
Think:
“National Grid meets CoreWeave.”
Why Radiant Could Learn From Oracle
Radiant lacks:
Enterprise software experience
Large-scale customer operations
Decades of cloud platform evolution
Oracle has all of that.
Why Oracle Could Learn From Radiant
Radiant understands:
Power economics
Infrastructure financing
Long-duration capital
Utility-scale thinking
areas where Oracle historically has less expertise.
If They Met In The Middle
The interesting thing is that both companies are converging toward something like:
Power ↓ Data Centre ↓ GPU Factory ↓ Cloud Platform ↓ Enterprise AI
The difference is where they started.
Layer
Oracle Strength
Radiant Strength
Power
Moderate
Exceptional
Data Centres
Strong
Exceptional
GPUs
Strong
Emerging
Cloud Platform
Exceptional
Good (via Ori)
Enterprise Sales
Exceptional
Developing
Sovereign AI
Moderate
Strong
Long-Term Infrastructure Finance
Moderate
Exceptional
The More Interesting Comparison
I actually think the closest opposite of Radiant is not Oracle.
It’s CoreWeave.
CoreWeave
Started with:
GPUs ↓ Cloud ↓ Data Centres ↓ Power
Radiant
Started with:
Power ↓ Data Centres ↓ Cloud ↓ GPUs
Those are almost exact inverses.
Oracle sits somewhere else entirely because it arrived carrying:
Databases + Enterprise Software + Cloud Platform
which neither CoreWeave nor Radiant possessed.
So my assessment would be:
CoreWeave and Radiant are the closest opposites.
Oracle and Radiant are converging from opposite ends of the technology stack.
By 2030, Oracle and Radiant may end up looking surprisingly similar externally, even though one began as a software giant and the other as an infrastructure and energy giant.
Reflective Journeys: Oracle vs Radiant
Yes, in many cases Oracle employees affected by AI-related restructuring could be strong candidates for Radiant, but it depends heavily on which part of Oracle they came from.
The interesting thing is that Oracle and Radiant are moving toward the same destination from opposite directions:
Oracle Database ↓ Cloud ↓ AI Infrastructure
Radiant Power ↓ Infrastructure ↓ AI Infrastructure
That creates a surprising amount of skill overlap.
Oracle Employees Radiant Should Recruit Aggressively
OCI Engineers
These are probably the highest-value hires.
Experience:
OCI regions
Cloud operations
Bare metal
Networking
Cloud automation
Radiant needs people who know how to operate cloud infrastructure at scale.
These engineers bring exactly that.
AI Infrastructure Engineers
Oracle has been building:
GPU superclusters
RDMA fabrics
RoCE networks
AI training environments
Those skills are directly transferable to:
Radiant AI factories
GPU clouds
Sovereign AI deployments
OCI SREs
Particularly valuable:
Capacity planning
Reliability engineering
Infrastructure automation
Fleet management
Radiant will need these people immediately as AI factories scale.
Data Centre Engineers
Oracle has been building data centres globally.
Skills:
Capacity planning
Facility operations
Power
Cooling
Commissioning
These map extremely well to Radiant’s infrastructure-first strategy.
Network Engineers
Potentially the most valuable category.
Particularly if they have:
RoCE
RDMA
EVPN/VXLAN
High-performance networking
AI infrastructure is increasingly network-limited rather than GPU-limited.
Observability Engineers
This is a category many AI infrastructure companies underestimate.
Skills:
OpenTelemetry
Prometheus
Grafana
Logging platforms
Distributed tracing
Radiant will eventually need to observe:
Power Cooling Networks Storage GPUs Training Jobs Cloud Platform
at enormous scale.
Oracle Employees Radiant May Need Less Of
Traditional ERP / Applications Teams
Experience in:
E-Business Suite
HR systems
Legacy applications
is less directly relevant.
Radiant is building infrastructure rather than enterprise applications.
Traditional Database Administration
Still useful, but lower priority.
Radiant’s biggest bottlenecks are more likely:
GPUs
Networking
Data centres
Cloud platforms
than Oracle Database administration.
Would It Be Good For The Employees?
Potentially yes.
Oracle is becoming:
Large AI Hyperscaler
Radiant is becoming:
AI Infrastructure Startup with Brookfield backing
Some engineers prefer:
Oracle
Stability
Massive scale
Mature processes
Existing customer base
Radiant
Building from scratch
More influence
Faster decision making
Potentially larger individual impact
If I Were Radiant’s CTO
The first Oracle hires I would target would be:
OCI Principal SREs
OCI Network Architects
OCI GPU Platform Engineers
OCI Capacity Engineers
OCI Observability Platform Engineers
OCI Data Centre Build Engineers
These people have already operated infrastructure at scales that Radiant wants to achieve.
Looking at Your Background
Based on the areas you’ve worked deeply in—observability, OpenTelemetry, Prometheus/Mimir/Loki/Tempo, Kubernetes, HPC, storage, automation, cloud platforms, and AI infrastructure—the type of role that would likely be most valuable to a company like Radiant is not a generic SRE.
It would be something closer to:
Principal Observability Engineer
AI Infrastructure Observability Architect
Staff SRE (AI Platforms)
Platform Engineering Lead
AI Factory Telemetry Architect
because one of the hardest problems these emerging AI infrastructure companies will face is creating observability across the entire stack:
Power ↓ Data Centre ↓ Network Fabric ↓ GPU Cluster ↓ Kubernetes / Slurm ↓ AI Workloads
Very few engineers have practical experience spanning that many layers.
One caveat: public reporting has discussed Oracle workforce reductions in various parts of the business, but I have not seen reliable evidence supporting a single confirmed figure of “30,000 layoffs” across Oracle as a whole. When evaluating career moves, it’s better to focus on the strategic trend—Oracle investing heavily in AI infrastructure and cloud—rather than any specific layoff number unless confirmed by Oracle itself.
Where is all the Money?
The short answer is:
The money is real, but most of it is not sitting in a bank account waiting to be spent.
What you’re seeing is a combination of:
Cash flow
Debt financing
Equity financing
Project finance
Infrastructure finance
Customer pre-commitments
Stock market valuations
The AI infrastructure boom is probably the largest capital deployment into technology infrastructure since the construction of the Internet and mobile networks.
and lenders treat those GPUs almost like collateral.
Similar to:
Mortgage ↔ House
Loan ↔ GPU Fleet
Oracle
Oracle is different.
Oracle generates tens of billions in annual revenue.
Their funding comes primarily from:
Operating Cash Flow
Database Revenue SaaS Revenue Support Contracts OCI Revenue
This is actual cash arriving every quarter.
Oracle can invest from profits.
Corporate Debt
Oracle also issues bonds.
For example:
Oracle Bond ↓ Investors buy it ↓ Oracle receives cash
This is normal corporate finance.
AWS
AWS funding is even simpler.
Amazon generates huge cash flows.
When AWS builds a data centre:
Retail Business + AWS Revenue + Debt Markets
fund it.
The money is real.
Microsoft
Microsoft is currently spending at extraordinary levels.
Funding comes from:
Windows
Office 365
Azure
LinkedIn
GitHub
Copilot
All producing cash.
Microsoft can spend tens of billions annually because they generate enormous free cash flow.
Nscale
Nscale is much more interesting.
Nscale doesn’t have Oracle’s cash flow.
Instead funding comes from:
Equity Investors
Strategic Investors
Infrastructure Finance
Project Finance
Future Customer Contracts
Think:
Power Agreement + Land + Customer Demand ↓ Banks lend money
Crusoe
Crusoe is heavily project-finance oriented.
Example:
OpenAI ↓ Needs Capacity
Oracle ↓ Needs Capacity
Crusoe ↓ Build Campus
The campus may be funded by:
Equity
Infrastructure loans
Project financing
Long-term customer commitments
Similar to how airports and power stations are financed.
Radiant
Radiant may have the strongest financing model.
Why?
Because Brookfield already finances:
Power stations
Airports
Ports
Railways
Data centres
worth hundreds of billions.
Brookfield understands:
Build Asset ↓ Generate Revenue ↓ Repay Debt
better than almost anyone.
Radiant can potentially tap into infrastructure capital that many neoclouds cannot.
Is The Money “Real”?
Yes.
But there are three different meanings.
Real Cash
Example:
Microsoft earns:
$100
Customer pays.
Microsoft receives:
$100 cash
Real money.
Debt
Example:
Bank lends:
$10 Billion
to build AI infrastructure.
Also real money.
But must be repaid.
Market Valuation
This is where people get confused.
Example:
CoreWeave market cap:
$56 Billion
That does NOT mean:
$56 Billion cash
exists.
It means:
Share Price × Shares Outstanding
equals $56B.
Much of that value exists “on paper.”
The Hidden Fuel: Pension Funds
Most people don’t realize who ultimately finances much of this.
The money often comes from:
Pension funds
Sovereign wealth funds
Insurance companies
Infrastructure funds
For example:
Teacher Pension ↓ Infrastructure Fund ↓ Brookfield ↓ AI Data Centre
The chain can be surprisingly long.
Why Everyone Is Comfortable Lending
The reason banks are willing to lend is simple:
They believe AI demand will continue growing.
Their assumption is:
GPU Demand > Debt Cost
If true:
Loans get repaid.
Investors make money.
Infrastructure grows.
If false:
Some companies will fail.
Some campuses will be underutilized.
Some lenders will take losses.
The Biggest Risk
The entire AI infrastructure sector is making a giant bet:
Future AI Demand
If AI demand keeps growing:
Oracle wins.
Microsoft wins.
CoreWeave wins.
Crusoe wins.
Nscale wins.
Radiant wins.
If demand slows dramatically:
The most leveraged companies suffer first.
That is why investors currently view:
Company
Financial Risk
Microsoft
Low
Oracle
Low
AWS
Low
Google
Low
Radiant/Brookfield
Moderate
Crusoe
Moderate
Nscale
Moderate-High
CoreWeave
High
The hyperscalers are largely spending from enormous existing cash flows. The neoclouds are spending mostly against future growth, future contracts, and infrastructure financing. The money is real, but much more of the neocloud funding stack depends on future demand continuing to justify today’s investments.
The 2026 AI Funding Diagram
Key changes since the Bloomberg/Morgan Stanley “AI Money Machine” chart from late 2025
OpenAI
Valuation increased from roughly $500B to over $730B–850B after its record funding rounds in 2026.
New major funding sources:
Amazon
SoftBank
Nvidia
OpenAI is now much less dependent on Microsoft than the original chart suggests.
Amazon (missing from the original)
Amazon is arguably the biggest omission now:
Invested approximately $50B in OpenAI.
Expanded AWS compute commitments.
OpenAI agreed to use AWS infrastructure and Trainium capacity.
SoftBank (missing from the original)
Became one of OpenAI’s largest financial backers.
Major participant in Stargate-style infrastructure funding.
CoreWeave
OpenAI relationship expanded to about $22.4B in AI infrastructure contracts.
Now one of OpenAI’s largest compute suppliers.
Public company rather than private neocloud startup.
Nvidia
Still sits at the center.
Added direct investment into OpenAI.
Continues investing in CoreWeave while simultaneously selling GPUs to it and buying capacity from it.
Nscale and Nebius
The original chart correctly anticipated their importance.
They now fit into a larger category of “GPU-native neoclouds” alongside CoreWeave.
Their role is increasingly as infrastructure providers for AI model companies rather than model developers themselves.
Nscale/Nebius increasingly recognized as AI infrastructure providers
For your interests in AI infrastructure, neoclouds, and hyperscalers, a more useful 2026 version would actually be an “AI Infrastructure Ecosystem Map” showing:
Nvidia
AMD
OpenAI
Microsoft
Amazon
Oracle
SoftBank
CoreWeave
Nebius
Nscale
Crusoe
xAI
Mistral
Figure AI
Stargate
with arrows for:
Capital investment
GPU purchases
Cloud contracts
Equity stakes
AI model consumption
That would better reflect where the industry sits today than the original Bloomberg graphic.
Now, it is mid year, so let’s look at IT/tech layoffs through mid-2026 compared to the past 10 years:
2026 Tech Layoffs (through June 2026)
Current total: ~156,000–172,000 tech workers laid off
As of June 9, 2026: 156,058 jobs cut across 50 tech companies
Some trackers show 172,130+ jobs cut for 2026
First 5 months (Jan-May): 128,940 tech workers laid off
March 2026 was the worst single month: 49,452 layoffs
Major employers: Oracle (30,000), Amazon (16,000–30,000), Meta, Microsoft, Dell
Comparison with Previous 10 Years
Year
Tech Layoffs
Key Driver
2026 (through June)
~156,000–172,000
AI restructuring, over-hiring correction
2025
~105,000–244,851
AI-led efficiency, economic uncertainty
2023
~263,000
Peak: Overhiring reversal, ad market collapse
2024
~152,000
AI restructuring, cost discipline
2022
~165,000
Rate hikes, post-ZIRP correction
2021
~10,000
Near-zero; record hiring year
2020
~80,000
COVID shock
2019
~60,000
Strategic pivots (ride-sharing, large tech)
2018
~60,000
Strategic pivots
2017
~20,000–50,000
Restructuring (Intel, Yahoo, Oracle)
2016
~20,000–50,000
Restructuring
Key Findings
2026 is NOT the worst year — it’s still behind the 2023 peak:
2023 remains the worst year on record with ~263,000 tech jobs cut
2026 is on track to potentially reach ~250,000–300,000 if the pace continues (currently at ~156K through June)
2026 has already surpassed 2024 (~152K) and 2022 (~165K) in just 5–6 months
The trajectory is concerning: With 128,940 layoffs in just 5 months and March being the worst month in over a year, 2026 could rival 2023 if the second half remains severe. However, as of mid-2026, it’s still approximately 40–45% below the 2023 peak.
The primary driver has shifted from 2022–23’s funding correction to AI-driven substitution — roles being cut may not return even when revenue grows.
Are we talking about a Revolution?
So 2023 was financial, 2026 is AI restructuring, so is this a revolution in the IT job market?
Yes, this represents a genuine revolution in the IT job market, but it’s more complex than a simple “AI replacing jobs” narrative. Here’s what’s actually happening:
Two Different Layoff Waves
Aspect
2022-2023 (Financial)
2026 (AI-Led)
Driver
Overhiring + rate hikes + funding correction
AI efficiency + cost-cutting + restructuring
Cited reason
” restructuring”
AI now the leading reason (May 2026)
AI’s share
Minimal
49,135 cuts (13-25% of total)
Why This Is a Revolution
1. Jobs Aren’t Just Being Cut — They’re Being Redefined
Routine, automation-prone roles fell 13% after ChatGPT’s debut
Analytical/technical/creative jobs grew 20% — AI is augmenting these roles
Not uniform elimination: AI reshapes more jobs than it replaces
2. The “AI Washing” Problem
Some companies exaggerate AI’s role to justify cuts that are actually about:
Cost-cutting and slowing demand
Correcting over-hiring from previous years
Cloud market leveling off (AWS example)
Reality: It’s both real displacement AND convenient scapegoating
3. Skill Requirements Are Shrinking for Some Roles
7% fewer skills needed in automation-prone occupations
New skills emerging: prompt writing, AI tools, human-AI collaboration
Workers need non-automatable skills: judgment, interpersonal communication
4. The Funding Narrative Changed
“Whether or not specific jobs are being replaced by AI, the funding for those positions certainly is.” — Andy Challenger, workplace specialist
CEOs face pressure to demonstrate AI investment value, making job cuts politically convenient.
The Bottom Line
Yes, this is revolutionary, but in a nuanced way:
✅Real transformation: Routine tasks are genuinely being automated ✅New demand: AI-augmented roles require different skills ⚠️Mixed motives: Some companies use AI as a blanket excuse ⚠️ Uncertain long-term: Short-term data shows reshaping, not mass elimination
For someone in your field (SRE, Kubernetes, observability), the outlook is different from entry-level roles:
Your work involves judgment, complex systems, and human coordination — harder to automate
But you’ll need AI literacy (prompting, AI tools in workflows)
The risk is not elimination but reduced team sizes with AI doing more of the routine monitoring/debugging
The tech industry’s guarantee of job stability is gone — this is the fundamental shift.
What are the Safe and Stable Jobs in IT?
Based on the latest data, here are the safe and stable IT jobs going into late 2026 and beyond, ranked by their resistance to AI disruption and growth trajectory:
Top Safe & Stable IT Roles (UK 2026–2035)
1. Cybersecurity Engineer 🛡️
Why safe:
Cyber threats continue to increase
AI creates new attack surfaces
Regulatory requirements keep growing
UK Salary:
Mid-Level: £55,000–£75,000
Senior: £75,000–£100,000
Principal/Lead: £100,000–£140,000
Growth Outlook: One of the most resilient technology careers for the next decade.
2. Cloud Architect ☁️
Why safe:
Strategic infrastructure design
Multi-cloud and hybrid-cloud complexity
Requires business and technical judgement
UK Salary:
Senior Cloud Architect: £90,000–£130,000
Principal Architect: £130,000–£170,000
Growth Outlook: Still seeing strong demand as enterprises modernise infrastructure.
3. AI / Machine Learning Engineer 🤖
Why safe:
Building and operating AI systems
Demand exceeds supply
Critical for AI adoption
UK Salary:
Mid-Level: £70,000–£100,000
Senior: £100,000–£140,000
Staff/Principal: £140,000–£220,000+
Growth Outlook: Among the strongest growth areas through 2035.
4. Senior Cloud Engineer ☁️
Why safe:
Designs and operates large cloud platforms
Increasing focus on automation and reliability
Deep infrastructure expertise remains difficult to automate
UK Salary:
£75,000–£110,000
Typical Skills:
AWS/Azure/GCP
Kubernetes
Terraform
Observability
Security
Growth Outlook: Strong demand across SaaS, fintech, AI and hyperscale companies.
5. Staff Cloud Engineer ☁️🚀
Why safe:
Technical leadership role
Cross-team architectural influence
Requires experience, judgement and organisational impact
UK Salary:
£100,000–£160,000
Elite AI/Hyperscaler firms: £160,000–£220,000+
Typical Employers:
Nscale
CoreWeave
Google
Microsoft
Growth Outlook: One of the safest senior technical career paths available.
6. Site Reliability Engineer (SRE) ⚙️
Why safe:
Reliability remains business-critical
AI infrastructure requires even more operational excellence
Combines software, operations, cloud and observability
UK Salary:
Mid-Level: £65,000–£85,000
Senior SRE: £85,000–£120,000
Staff SRE: £120,000–£180,000+
Growth Outlook: Particularly strong in AI, fintech and hyperscale environments.
7. Data Engineer 📊
Why safe:
Data pipelines underpin AI systems
Data governance requirements increasing
Real-time analytics demand growing
UK Salary:
£60,000–£90,000
Senior: £90,000–£130,000
Growth Outlook: Consistently one of the most in-demand engineering roles.
8. Technical Project Manager 📋
Why safe:
Human coordination remains difficult to automate
AI increases project complexity
UK Salary:
£60,000–£90,000
Senior: £90,000–£130,000
9. Technical Product Manager 🧭
Why safe:
Strategy, prioritisation and stakeholder alignment
Strong human and business focus
UK Salary:
£70,000–£110,000
Senior: £110,000–£150,000
Key Upgrades to Stay Safe:
AI literacy — prompt writing, AI tools in workflows
Security focus — automation security is the 2026 priority
Observability + AI — AI-driven analytics becoming standard
Bottom Line: What Makes Jobs “Safe”
Factor
Safe Jobs
Risky Jobs
Task type
Judgment, coordination, creativity
Routine, repetitive, automation-prone
Skills
Strategic design, security, AI literacy
Structured, predictable tasks
Human element
Cross-functional management
Solo execution
Growth
17-20%+ through 2030
Declining or flat
The safest path: Combine your existing SRE/Cloud expertise with AI tools + security focus — this is the sweet spot for 2026-2035.
The job market is still pretty tight in April 2026, and IT is tougher than the headline unemployment numbers suggest because employers are hiring more selectively, keeping vacancy growth subdued, and raising the bar for experience. UK labour-market reporting says hiring is close to stabilising, but conditions remain challenging, and technology roles are resilient relative to the wider market rather than broadly easy to land [1][2].
What is happening
Employers are still cautious after a long slowdown in vacancies and hiring confidence, with UK reports describing the market as close to bottoming out rather than clearly recovering [1][2].
Competition is high because more candidates are chasing fewer openings, especially in entry-level and mid-level roles [3][2].
In IT, companies are still investing, but they are being very selective about which roles they open and often prefer people with niche, immediately useful skills [4][1].
Why IT feels harder
AI is reshaping hiring, and some employers are explicitly reducing junior or commodity-type roles because automation can handle part of that work [4][2].
Layoffs in tech have added experienced candidates back into the market, which makes competition worse for everyone else [5][6].
Many postings now expect broader skill sets than before, so “good enough” candidates often get filtered out quickly [4][3].
Where demand still exists
Cyber security, data, AI, cloud, and other specialist infrastructure roles are still among the strongest areas in the UK IT market [4][1].
Engineering and technology hiring is described as relatively more resilient than the wider labour market, even though demand is still weak compared with boom periods [1].
Employers are still looking for people who can deliver immediately, particularly in roles tied to automation, digital transformation, and AI enablement [4][1].
Practical read
If you are already in IT, the market is difficult but not dead: experienced people with scarce skills are still getting opportunities, while generic support, junior dev, and broad “all-rounder” roles are the hardest to place [4][2]. For job seekers, the main challenge in 2026 is not absolute lack of jobs, but a mismatch between what many employers want and what most applicants can show on paper [3][2].
A simple way to think about it: 2026 is not a “no jobs” market, it is a “harder to get shortlisted” market, especially in IT [1][3].
How long to find IT job after layoff 2026?
In 2026, a realistic IT job-search timeline after a layoff is often 4 to 6 months, with some people landing in 6 to 8 weeks and others taking much longer depending on seniority, specialization, location, and how targeted their search is [1][2]. Broader job-market data also suggests the average job search after a layoff is around five to six months, which lines up with the tech-specific estimates [2].
Typical timeline
Fast outcomes: about 6 to 8 weeks if your skills are in demand, you have strong referrals, and you apply very selectively [1][3].
Common outcome: about 4 to 6 months for many IT professionals in 2026 [1][2].
Slower cases: 8 months or more if you are aiming for remote roles, a narrow niche, or senior positions with very few openings [4][5].
Why it takes longer
ATS filtering and high application volumes mean many strong candidates never reach a recruiter [1].
Tech layoffs have increased the supply of experienced applicants, so competition is tighter than in a normal year [6][7].
Employers are hiring more cautiously and often want people who can contribute immediately with minimal ramp-up [8][9].
What affects your speed
Seniority matters: mid-level specialists often move faster than generalists because they can show clear value [3][1].
Location and flexibility matter: being open to onsite or hybrid roles can shorten the search compared with insisting on fully remote work [4].
Targeting matters: referred candidates and focused applications usually outperform broad mass-applying [1].
Practical expectation
For someone with solid IT experience, a good planning assumption in 2026 is three to six months, with a faster result possible if you have in-demand cloud, security, observability, or platform skills and a strong network [8][9][1]. If your profile is broader or your target is very specific, plan for the search to last longer and budget accordingly [2][5]
What strategies cut IT job search to under 3 months after layoff
To get under 3 months, the winning pattern is: target fewer roles, use warm introductions, tailor aggressively, and move fast in the first 2 weeks [1][2]. The fastest recoveries are not from spraying applications everywhere; they come from building a shortlist of target companies, speaking to people inside them, and getting referred before the role is crowded [1][6].
What works best
Build a target list of about 10 to 15 companies and focus on them hard rather than applying broadly [1].
Reach out to 3 people at each target company, ideally future teammates or adjacent peers rather than only recruiters [1].
Ask for short, specific conversations, then follow up every 2 to 3 weeks with something useful or relevant [1].
Keep your CV tightly matched to each role so it is easy to read and directly aligned with the posting [3][7].
Speed levers
Apply in the first 24 to 72 hours after a role is posted, when fewer candidates have piled in [1].
Use on-site or hybrid options if you can tolerate them, because sticking to fully remote roles can slow the search [1].
Stay in your current lane unless a pivot is truly justified; searches are faster when you sell proven experience rather than a brand-new direction [1].
Add contract, interim, or freelance work as a bridge if the market is slow; that keeps income coming and preserves momentum [2][9].
First 30 days
Days 1 to 3: fix CV, LinkedIn, references, and a target list [2].
Days 4 to 10: start outreach and referrals before spending heavy time on applications [1][6].
Days 10 to 30: run parallel tracks of networking, direct applications, and interview prep so you are not waiting on any one channel [2][3].
Keep a tracker so you can see which companies and contacts actually produce interviews [2].
For IT roles
The best odds of getting under 3 months are in higher-demand areas like cloud, security, data, platform engineering, and AI-adjacent infrastructure work [11][12]. Generalist support or commoditised roles usually take longer, so narrowing your pitch to scarce, business-critical skills matters more than ever [11][13]. In IT, referrals and a very specific value proposition often beat raw application volume [1][6].
Simple rule
If you want a sub-3-month outcome, think in terms of 10 target firms, 30 meaningful contacts, 2 tailored applications per day, and interview prep from day one [1][2][3]. That combination is much more likely to produce momentum than waiting for job boards to do the work [1][7].
How to use AI to help job searching
AI can help most if you use it to reduce admin, improve targeting, and sharpen your pitch rather than to mass-apply for roles. The biggest wins are tailoring CVs to each role, drafting outreach messages, organizing applications, and preparing for interviews faster [1][2][5].
Best uses
Tailor your CV to a job description by extracting keywords and matching your experience to the role [1][4][6].
Draft cover letters and recruiter messages quickly, then edit them so they sound like you [1][5].
Build a shortlist of target companies and roles from your skills, location, and preferences [1][7].
Track applications, follow-ups, interview dates, and contacts in one place [3][5].
Prepare for interviews with role-specific questions, mock answers, and STAR-story prompts [2][10].
A good workflow
Paste the job description into AI and ask for the top skills, likely screening keywords, and gaps in your CV [1][4].
Ask it to rewrite your summary and bullets around measurable outcomes, not responsibilities [2][10].
Generate a tailored outreach note for a hiring manager, recruiter, or employee referral contact [1][2].
Use AI to turn your notes into a cleaner application tracker and follow-up plan [3][5].
Before interviews, ask for likely technical and behavioral questions based on the role and company [2][10].
What works especially well in IT
For IT roles, AI is most useful when you use it to map your experience to specific stacks and outcomes, such as cloud migration, observability, DevOps, security, data engineering, or platform reliability [1][4]. It can help you turn broad experience into stronger role-specific language, which matters a lot when recruiters are filtering for exact keywords [1][4]. It is also helpful for finding adjacent roles you may not have considered, especially if you want to pivot within infrastructure or operations [7][10].
What not to do
Do not send AI-written applications without editing them for accuracy and voice [1][6].
Do not rely on AI scores alone; they can miss context or overrate generic keyword stuffing [8][5].
Do not use it to invent experience, certifications, or achievements [10].
Do not mass-apply just because AI makes it easy; the best results still come from targeted roles and real networking [11][2].
Simple prompt pattern
A strong prompt is: “Here is my CV and this job description. Identify missing keywords, rewrite my summary for this role, suggest 5 stronger bullets, and draft a short recruiter message.” That gives you a focused output instead of a generic blob [1][4][10].
So far in 2026, the biggest IT/tech layoffs have been driven by AI spending, restructuring, and cost cuts, with published trackers putting the total anywhere from roughly 45,000 to nearly 94,000 cuts depending on scope and date [1][2][3]. The single largest named cut is Amazon’s 16,000 corporate layoffs in January, while Oracle, Meta, Atlassian, Block, Pinterest, and a growing list of others have also announced significant reductions [1][4][5][6].
Biggest known layoffs
Amazon: 16,000 jobs cut in 2026 so far, the largest single contributor to year-to-date tech layoffs [1][7].
Oracle: reports range from “thousands” to as many as 30,000 jobs, with widespread cuts beginning at the end of March [8][4][9].
Meta: multiple rounds in 2026, including about 700 jobs in March and earlier Reality Labs cuts of around 1,000 roles [10][5].
Atlassian: about 1,600 jobs, or 10% of its workforce, announced in March [6].
Block: 4,000 jobs, framed as a shift toward AI and automation [11].
Pinterest: roughly 675 jobs, about 15% of staff, tied to AI and restructuring [11][12].
Other notable cuts
GoPro announced 145 layoffs in April as part of restructuring and cost reduction [6].
EBay, WiseTech Global, Livspace, ANGI Homeservices, and MercadoLibre were also listed in early-2026 AI-related layoff roundups [11].
Reports also mention cuts at Disney, Snap, Epic Games, Riot Games, Salesforce, Autodesk, and others across the first quarter [2][13][14].
What the numbers say
One tracker-based roundup put early-2026 tech layoffs at 45,363 globally by early March [1].
Another put the figure at 78,557 by early April, while TrueUp-based reporting cited about 91,739 impacted workers at 229 layoff events [3][15].
A March report said about 9,238 cuts were directly linked to AI adoption and automation, roughly one-fifth of the total then [11].
The broad pattern across reports is that the U.S. accounts for most of the job losses and AI is now a major stated reason rather than just a background trend [1][3].
Important caveat
These totals vary because different trackers count different things: announced vs confirmed cuts, tech-only vs broader IT-adjacent roles, and single layoffs vs multiple rounds at the same company [1][2][16]. That means the safest takeaway is not one exact number, but that 2026 has already seen a very large wave of tech layoffs, led by Amazon and Oracle, with AI investment a central driver [1][4][16].
—
What is actually happening in 2025–2026
Tech layoffs re-accelerated through 2025, with over 100,000 tech workers cut and more than 200 tech companies reducing headcount globally.[economictimes]
Many of these 2025 cuts came from large players (Amazon, Intel, TCS, Google, Meta) shifting priorities, especially towards AI and away from older or lower‑margin lines.[tomshardware]
Early 2026 has already seen fresh rounds from firms like Meta (Reality Labs), Citigroup, and BlackRock, suggesting the 2025 pattern is carrying into this year.[business-standard]
Why leaders expect more cuts in 2026
Surveys of executives show a clear bias towards staying lean: roughly two‑thirds of CEOs say they plan to either cut or hold headcount flat in 2026 rather than grow it.[saastr]
One 2025 survey of 1,000 US business leaders found half had already pulled back on hiring, nearly 40% had done layoffs in 2025, and a majority expected further layoffs to be likely in 2026.[hrdive]
Another survey of hiring managers reported that more than half expect layoffs in 2026 and see AI as a top driver of those cuts, especially for white‑collar roles.[informationweek]
AI, “invisible unemployment,” and who is most exposed
A growing chunk of the pain is “invisible”: roles quietly eliminated via attrition, aggressive performance management, relocation/RTO pressure, and not backfilling departures, so the headline layoff numbers understate the chill.[saastr]
Economists and industry observers describe 2026 as a “Great Freeze”: fewer new openings, more restructuring, and companies using AI plus process changes to do the same work with fewer people.[linkedin]
High‑salary staff without strong AI or automation skills, recently hired employees, and some entry‑level roles are viewed by executives as the highest‑risk groups for future cuts.[hrdive]
How this likely feels in tech and AI infra
For people in tech, 2026 is likely to feel like a grinding reset: fewer net new roles, more churn between companies, and continued pressure on anything tied purely to speculative AI or overbuilt infra.[info.siteselectiongroup]
At the same time, companies are heavily investing in a smaller core of people who can build, operate, and productize AI and automation, including infra and observability talent, rather than cutting across the board.[finalroundai]
Practical implications for you
Treat 2026 as a year to be defensive:
Make sure your current role is visibly tied to cost savings, reliability, or revenue, not just “innovation theatre”.[perplexity]
Double down on AI‑adjacent skills (MLOps, GPU/AI infra, automation with AI copilots) so you’re in the “kept and retrained” cohort rather than the expendable one.[tomshardware]
If you’re in AI/data‑center/infra, the risk is more about over‑concentration in a fragile employer or product line than the whole category disappearing; diversified or sovereign‑backed infra tends to ride out the cycle better.[perplexity]
In 2025, economic analysts and sociologists, most notably in a widely discussed analysis by The Economist, have identified Generation X (born 1965–1980) as the “real loser generation” due to a unique convergence of financial and social setbacks.
The primary reasons Gen X is characterized this way include:
Wealth Lag: Despite being at their peak earning years, Gen X has significantly less wealth than previous generations at the same age. For example, 2025 data shows that Millennials at age 31 have roughly double the wealth that the average Gen Xer had at that same point in their life.
The “Sandwich” Squeeze: Gen X is currently under intense pressure as the “Sandwich Generation,” simultaneously caring for aging parents and supporting their own children. Over 54% of Americans in their 40s are now balancing these dual caregiving roles.
Poor Market Timing: This cohort faced a “lost decade” in the stock market during the 2000s, precisely when they should have been building wealth. They entered the workforce during recessions and were hit by the 2008 financial crisis just as they were entering their prime career stages.
Invisible at Work: Many Gen Xers report feeling invisible in a corporate landscape that increasingly values younger “tech-native” talent (Millennials/Gen Z) or retains aging Baby Boomer leaders. Some corporations are reportedly “skipping over” Gen X for C-suite promotions in favor of younger leaders.
Retirement Anxiety: Unlike Boomers who often had stable pensions, Gen X must rely on volatile 401(k) plans and a shaky Social Security outlook. Nearly 60% of Gen Xers now expect to work past age 65.
Cultural Neglect: Often called the “latchkey kids” or the “forgotten generation,” Gen X is largely ignored in the cultural “generational wars” between Boomers and Millennials. They lack the media attention and political influence of the larger cohorts that flank them.
We have some wins
Gen X has been pivotal in education, technology, leadership, and cultural change, often acting as the **bridge** between older and younger cohorts.
Tech and innovation advantages
– Gen X was the first cohort to grow up alongside personal computers, the internet, and mobile phones, giving them a rare comfort with both analog and digital worlds.
– Many Gen X entrepreneurs lead in adopting new technologies and using them to create innovative business models, especially in tech, finance, and e‑commerce.
Educational and career gains
– Gen X was the first generation to face a labor market that effectively required postsecondary education for good jobs and responded with higher college attainment than Baby Boomers at similar ages.
– College‑educated Gen Xers typically enjoy higher incomes and greater wealth than less‑educated peers, showing that many in this cohort successfully leveraged education into upward mobility.
Leadership and workplace strengths
– Gen X workers are now heavily represented in senior and executive roles, bringing deep institutional knowledge, strong work ethic, and problem‑solving skills to leadership.
– Employers see Gen X as especially adaptable and resilient, having navigated repeated economic and technological shifts while still driving transformation in their organizations.
Bridge between generations
– Positioned between Boomers and Millennials, Gen X is widely described as a mediator generation that understands traditional hierarchies and newer, more fluid work cultures, smoothing communication across age groups.
– In workplaces, Gen X frequently acts as the connector between colleagues who struggle with digital tools and those who are “always online,” helping teams stay cohesive and productive.
Cultural and lifestyle benefits
– Gen X helped define late‑20th‑century and early‑internet culture: from alternative music and independent film to early online communities and gaming, leaving a lasting cultural footprint.
– Compared with older cohorts, many Gen Xers place a high value on work‑life balance and flexibility and have been key drivers in normalizing remote work, flexible hours, and more autonomous, less hierarchical work styles.
Conclusion
Yep, balancing things up, I can conclude we are the losers…