AI is not killing observability as a discipline, but it is fundamentally changing how observability is done. The traditional model of “collect everything, store everything, and let humans investigate later” is becoming increasingly impractical in AI-driven infrastructures.
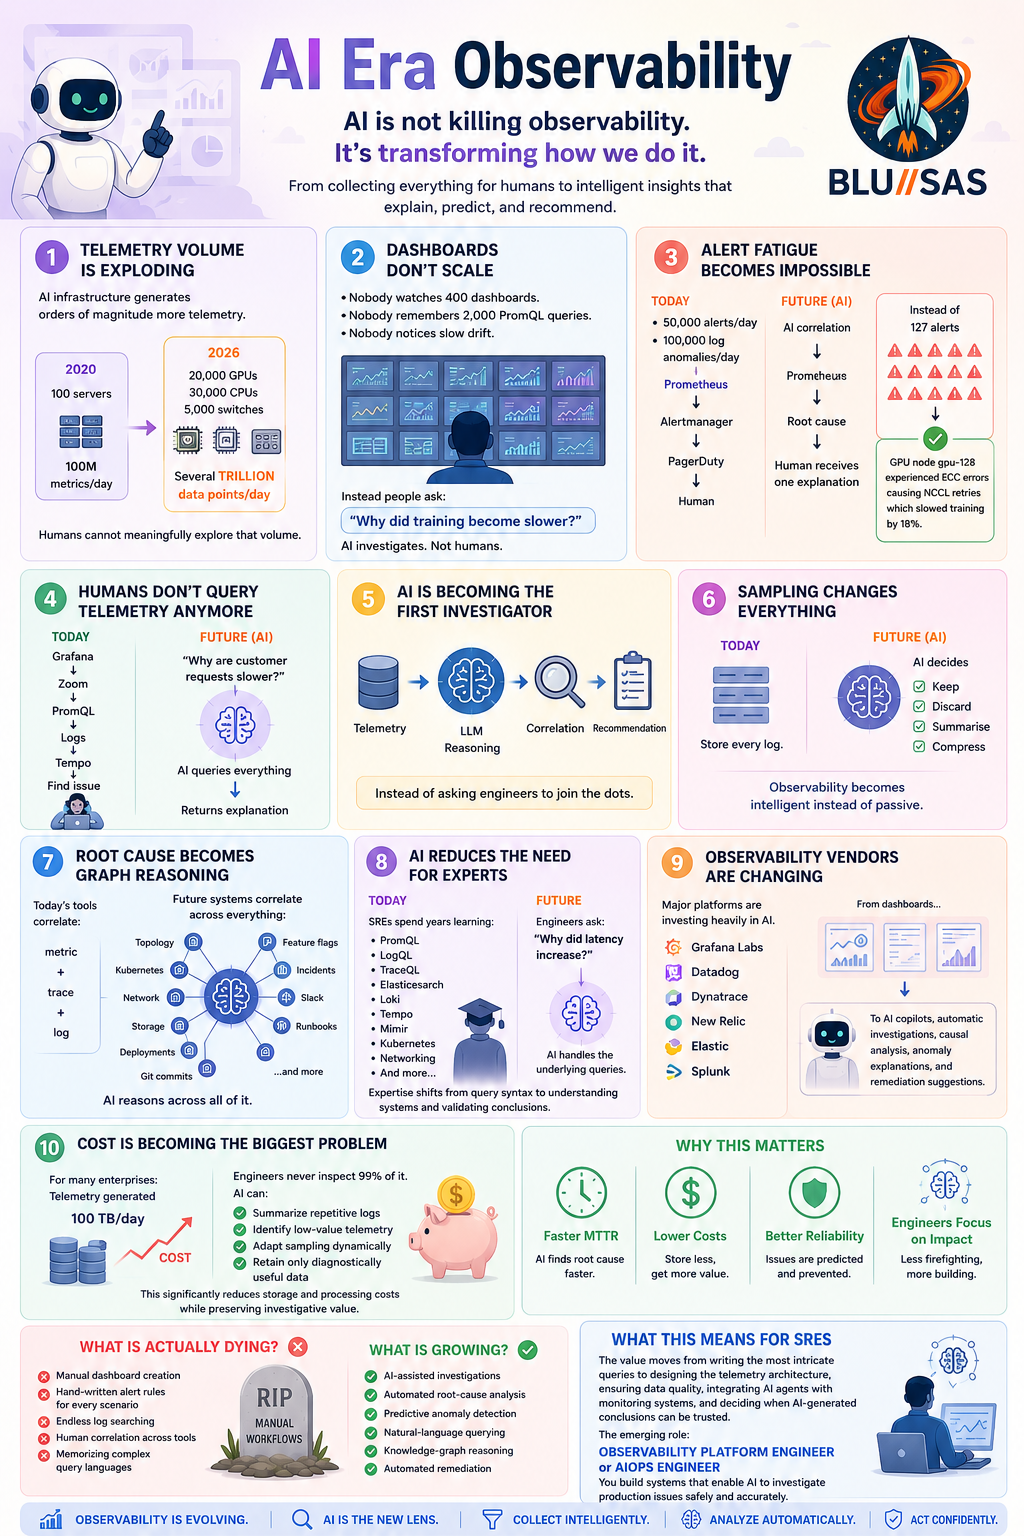
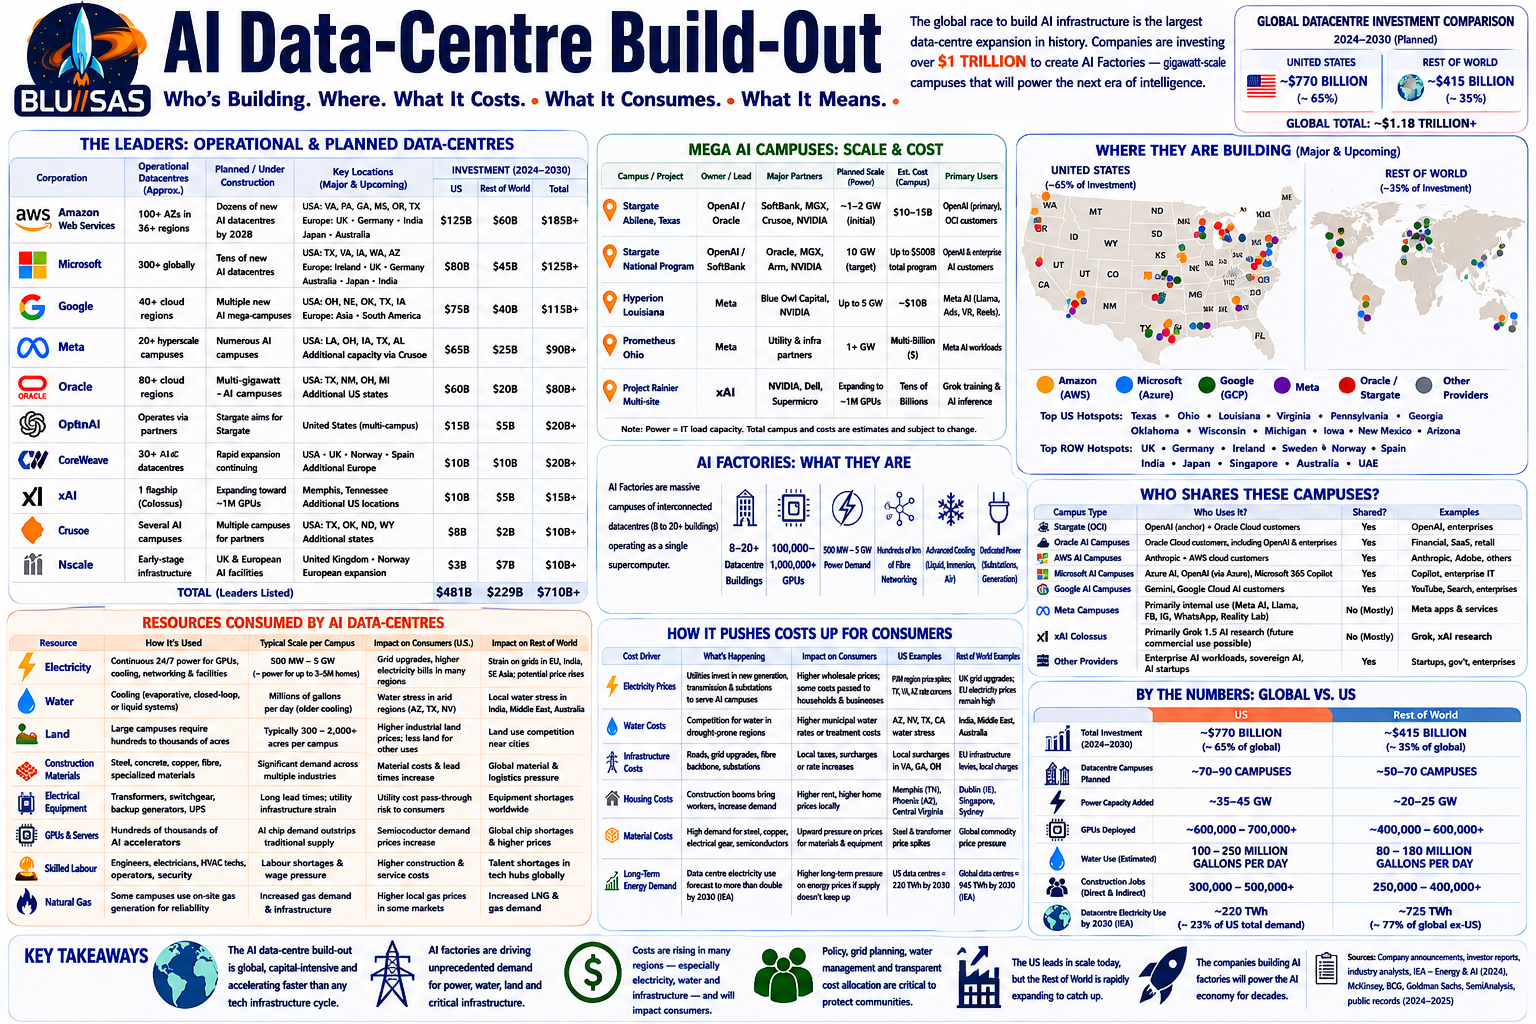
1. Telemetry volume is exploding
Modern systems produce far more telemetry than they did five years ago.
An AI factory may contain:
- Tens of thousands of GPUs
- Hundreds of thousands of CPU cores
- High-speed fabrics (RoCE, InfiniBand)
- Kubernetes
- Distributed storage (Ceph, Lustre, GPFS)
- AI inference services
- LLM gateways
Each component exports metrics, logs, traces and events.
For example:
2020

100 servers
↓
100 million metrics/day

2026

20,000 GPUs
30,000 CPUs
5,000 switches

↓

Several trillion data points/day
Humans cannot meaningfully explore that volume.
2. Dashboards don’t scale
Traditional observability assumes people sit looking at Grafana dashboards.
Reality:
- nobody watches 400 dashboards
- nobody remembers 2,000 PromQL queries
- nobody notices slow drift
Instead people increasingly ask:
“Why did training become slower?”
AI investigates.
Not humans.
3. Alert fatigue becomes impossible
Large organisations often generate
- 50,000 alerts/day
- 100,000 log anomalies/day
Historically:
Prometheus
↓
Alertmanager
↓
PagerDuty
↓
Human
Future:
Prometheus
↓
AI correlation
↓
Root cause
↓
Human receives one explanation
Instead of:
127 alertsEngineer receives
GPU node gpu-128 experienced ECC errors causing NCCL retries which slowed training by 18%.
4. Humans don’t query telemetry anymore
Traditional workflow
Grafana
↓
Zoom
↓
PromQL
↓
Logs
↓
Tempo
↓
Find issue
Future
"Why are customer requests slower?"
↓
AI
↓
queries everything
↓
returns explanation
Natural language replaces much of manual exploration.
5. AI is becoming the first investigator
Large enterprises increasingly build systems like:
Telemetry
↓
LLM
↓
Reasoning
↓
Correlation
↓
Recommendation
Instead of asking engineers to join the dots.
6. Sampling changes everything
Historically:
Store every log.Now:
AI decides

Keep
Discard
Summarise
Compress
Observability becomes intelligent instead of passive.
7. Root cause becomes graph reasoning
Today’s tools often correlate:
metric
+
trace
+
log
Future systems correlate:
- topology
- Kubernetes
- network
- storage
- deployments
- Git commits
- feature flags
- incidents
- Slack discussions
- runbooks
into one knowledge graph.
AI reasons across all of it.
8. AI reduces the need for experts
Today an SRE may spend years learning:
- PromQL
- LogQL
- TraceQL
- Elasticsearch
- Loki
- Tempo
- Mimir
- Kubernetes
- networking
Future engineers may simply ask:
Why did latency increase?
The AI handles the underlying queries.
Expertise shifts from query syntax to validating conclusions and understanding system design.
9. Observability vendors are changing
Every major platform is investing heavily in AI assistants.
Examples include:
- Grafana Labs
- Datadog
- Dynatrace
- New Relic
- Elastic
- Splunk
They’re moving from:
- dashboards
to:
- AI copilots
- automatic investigations
- causal analysis
- anomaly explanations
- remediation suggestions
10. Cost is becoming the biggest problem
Storage costs are growing faster than engineering budgets.
For many enterprises:
Telemetry generated

100 TB/day
Engineers never inspect 99% of it.
AI can:
- summarize repetitive logs
- identify low-value telemetry
- adapt sampling dynamically
- retain only diagnostically useful data
This can significantly reduce storage and processing costs while preserving investigative value.
What is actually dying?
It is not observability itself, but the manual workflows around it.
Declining:
- Manual dashboard creation
- Hand-written alert rules for every scenario
- Endless log searching
- Human correlation across tools
- Memorizing complex query languages
Growing:
- AI-assisted investigations
- Automated root-cause analysis
- Predictive anomaly detection
- Natural-language querying
- Knowledge-graph reasoning
- Automated remediation
What this means for SREs
For someone with your background in observability platforms, this shift is an opportunity rather than a threat. The value moves away from being the person who can write the most intricate PromQL query and toward designing the telemetry architecture, ensuring data quality, integrating AI agents with monitoring systems, and deciding when AI-generated conclusions can be trusted.
The emerging role is less “dashboard builder” and more Observability Platform Engineer or AI Operations (AIOps) Engineer—someone who builds systems that enable AI to investigate production issues safely and accurately. That combination of platform engineering, distributed systems, and AI integration is likely to be in increasing demand over the next decade.
What is AI Observability?
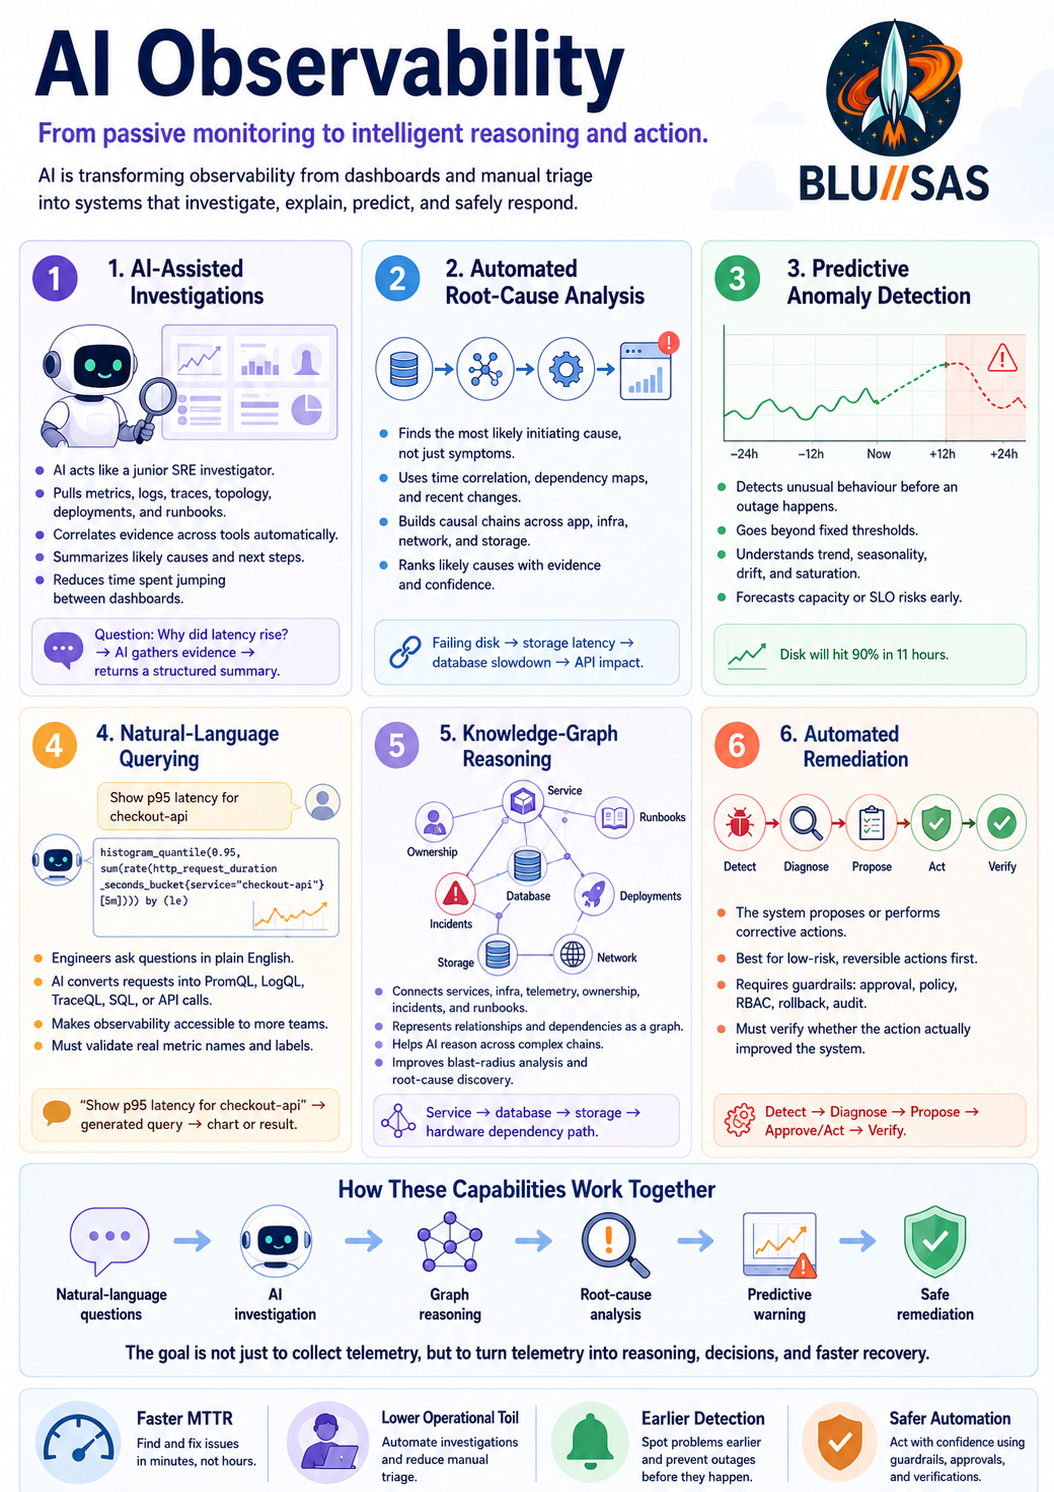
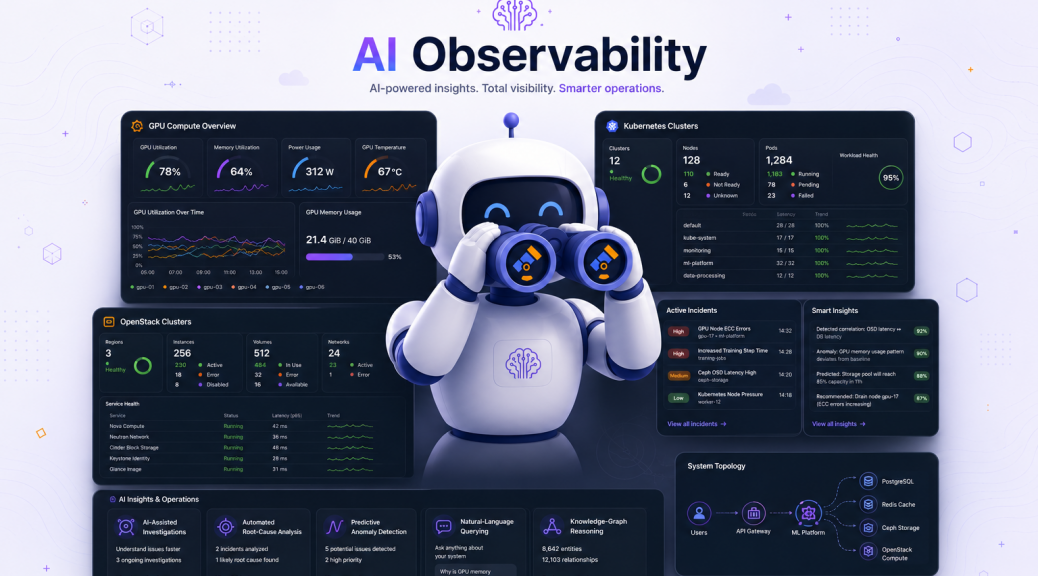
AI-era observability is moving from human-driven inspection to machine-assisted reasoning over telemetry, topology, history and operational knowledge.
The key shift is this:
Old observability:

Metrics + logs + traces
        ↓
Dashboards and alerts
        ↓
Human investigates
        ↓
Human decides
        ↓
Human fixes


AI-era observability:

Metrics + logs + traces + topology + deployments + runbooks + incidents
        ↓
AI correlation and reasoning layer
        ↓
Probable cause, blast radius, next action
        ↓
Human approval or automated remediation
Below is a detailed breakdown of the six areas.
1. AI-assisted investigations
What it means
AI-assisted investigation is where an AI system acts like a junior SRE investigator sitting beside you.
It does not necessarily fix the issue automatically. Its main job is to reduce the time spent asking basic investigative questions.
Instead of you manually jumping between:
Grafana → Prometheus/Mimir → Loki → Tempo → Kubernetes → Git → Slack → Runbooksyou ask something like:
Why did checkout latency increase after 14:05?
The AI then queries multiple systems and returns a structured investigation.
What it does
A good AI investigation assistant can:
- Detect the relevant service, namespace, cluster or tenant.
- Pull related metrics.
- Search logs around the incident window.
- Inspect traces for slow spans.
- Compare current behaviour against baseline behaviour.
- Check recent deployments.
- Check Kubernetes events.
- Check node, pod, container and network health.
- Retrieve relevant runbooks.
- Summarise likely causes.
- Recommend next diagnostic steps.
Example
You ask:
Why is the inference API slower?
The AI investigates:
1. Latency increased at 10:17.
2. p95 rose from 420 ms to 1.8 s.
3. Error rate did not increase.
4. GPU utilisation remained high.
5. Queue depth increased.
6. New model version was deployed at 10:12.
7. Logs show repeated batching timeout warnings.
8. Traces show delay before GPU execution, not during execution.
Result:
Likely issue:
The model service is queueing requests before GPU execution.

Probable cause:
The new batching configuration increased max_batch_wait_ms from 20 ms to 250 ms.

Recommended action:
Rollback batching config or reduce batch wait threshold.
That is much faster than manually checking ten dashboards.
What data it needs
AI-assisted investigation works best when it has access to:
Metrics:
- RED metrics: rate, errors, duration
- USE metrics: utilisation, saturation, errors
- Kubernetes pod/node metrics
- GPU metrics
- Network metrics
- Storage metrics

Logs:
- Application logs
- Kubernetes events
- System logs
- Ingress/controller logs
- Deployment logs

Traces:
- Request path
- Slow spans
- Upstream/downstream dependencies
- Database/storage/API calls

Context:
- Deployment history
- Git commits
- Feature flags
- Config changes
- Runbooks
- Incident history
- Service ownership
Without context, AI just summarises telemetry. With context, it can investigate.
SRE value
For SREs, this means less time doing mechanical investigation and more time validating the diagnosis.
The future SRE skill is not just:
Can I write PromQL?It becomes:
Can I design telemetry so AI can reason correctly?
Can I validate the AI's conclusion?
Can I prevent unsafe remediation?
Can I encode good operational knowledge into the platform?
2. Automated root-cause analysis
What it means
Automated root-cause analysis, or automated RCA, is the process of identifying the most likely initiating cause of a production issue without relying entirely on manual human correlation.
It tries to answer:
What actually started the incident?Not merely:
What symptoms are currently visible?This distinction matters.
Symptom versus root cause
Example incident:
Customer latency is high.
API pods are slow.
Database queries are slow.
Storage latency is high.
Ceph OSDs are rebalancing.
One storage node has a failing disk.
The symptoms are:
High API latency
Slow database responses
Increased request duration
More timeout warnings
The probable root cause is:
A failing disk caused Ceph recovery/rebalancing,
which increased storage latency,
which slowed the database,
which slowed the API.
Automated RCA attempts to build that causal chain.
How automated RCA works
There are several techniques.
1. Temporal correlation
The system checks what changed first.
10:01 disk errors begin
10:03 Ceph recovery starts
10:05 storage latency rises
10:07 database latency rises
10:09 API latency rises
10:10 customer alerts fire
The earliest credible abnormal event is often close to the root cause.
2. Topology-aware analysis
The system understands dependencies.
frontend
   ↓
checkout-api
   ↓
postgres
   ↓
ceph/rbd
   ↓
osd-node-07
If osd-node-07 is unhealthy, and all dependent systems are degraded, the RCA engine can infer blast radius.
3. Change correlation
The system checks recent changes:
Deployments
Config changes
Feature flags
Kernel updates
Node drains
Network changes
Storage migrations
Certificate rotations
DNS changes
Autoscaling events
Many incidents are change-induced. A useful RCA system always asks:
What changed recently?4. Statistical anomaly ranking
The system ranks abnormal signals.
For example:
Signal                         Abnormality score
GPU ECC errors                 0.98
NCCL retry count               0.94
Training step duration         0.91
CPU usage                      0.22
Memory usage                   0.18
The AI focuses on the strongest abnormal signals.
5. Causal graph reasoning
This is more advanced.
Instead of treating metrics as isolated time series, the system builds a causal model:
Bad disk
  → Ceph recovery
  → Storage latency
  → Database latency
  → API latency
  → Customer impact
This is much closer to how an experienced SRE thinks.
Example automated RCA output
Incident:
Checkout latency p95 increased from 300 ms to 2.4 s.

Likely root cause:
PostgreSQL read latency increased due to degraded Ceph RBD volume performance.

Evidence:
- API latency increased at 13:42.
- PostgreSQL read latency increased at 13:39.
- Ceph pool latency increased at 13:36.
- OSD 12 reported slow ops and disk errors at 13:34.
- No relevant application deployment occurred in the previous hour.

Blast radius:
- checkout-api
- payment-api
- order-history-api

Recommended action:
- Mark OSD 12 out if disk errors continue.
- Move affected workload if possible.
- Check Ceph recovery/backfill limits.
- Consider temporarily scaling API timeout thresholds.
What makes automated RCA hard
Automated RCA is difficult because distributed systems are messy.
Common problems:
Correlation is not causation.
Multiple things can break at once.
Telemetry may be missing.
Logs may be noisy.
Clocks may not be perfectly synchronised.
Service dependency maps may be stale.
The root cause may be outside the monitored system.
This is why good automated RCA usually gives:
Probable cause
Confidence level
Supporting evidence
Contradicting evidence
Recommended next checks
It should not pretend to be certain when it is not.
3. Predictive anomaly detection
What it means
Predictive anomaly detection tries to detect abnormal behaviour before it becomes a major incident.
Traditional alerting says:
Alert when disk usage > 90%.Predictive alerting says:
Disk usage is growing at a rate that will hit 90% in 11 hours.That is a major shift.
Traditional threshold alerting
Example:
Alert: DiskAlmostFull
Condition: disk_used_percent > 90
This is simple and useful, but it misses context.
A disk at 85% may be fine if it grows slowly.
A disk at 60% may be dangerous if it is growing rapidly.
Predictive anomaly detection
Predictive systems look at behaviour over time:
Normal pattern:
- CPU rises during business hours
- drops overnight
- spikes during batch processing

Abnormal pattern:
- CPU rises at midnight
- no scheduled job exists
- memory grows continuously
- request rate is normal
The system detects that the pattern is unusual, even if no hard threshold has been crossed.
Types of predictive anomalies
1. Trend-based prediction
Useful for capacity planning.
Disk usage will reach 90% in 3 days.
Mimir object storage will exceed budget in 12 days.
Kafka partition disk will fill in 9 hours.
Ceph pool will hit near-full ratio this weekend.
2. Seasonality-aware anomaly detection
Useful for normal daily/weekly cycles.
Example:
CPU at 80% at 10:00 Monday may be normal.
CPU at 80% at 03:00 Sunday may be abnormal.
The system learns expected patterns.
3. Multivariate anomaly detection
Looks at several signals together.
For example:
Request rate: normal
Error rate: normal
Latency: high
CPU: normal
Database latency: high
Network retransmits: high
Individually, some metrics may not trigger alerts. Together, they reveal an abnormal condition.
4. Behavioural drift detection
Useful in AI and ML platforms.
Example:
Training jobs are completing successfully,
but average step time has increased by 12% over two weeks.
No incident has occurred yet, but performance is drifting.
5. Saturation prediction
Very useful for SRE.
GPU memory saturation likely within 40 minutes.
Kubernetes node memory pressure likely in 2 hours.
Ceph recovery will saturate backend network.
Kafka consumer lag will exceed SLO in 25 minutes.
Example
A predictive anomaly detector observes:
Mimir ingest rate: stable
Object storage write latency: slowly increasing
Compactor duration: increasing
Query latency: increasing
Store-gateway cache hit rate: decreasing
It predicts:
Within 6 hours, users will experience slow dashboard loads.The remediation might be:
Scale store-gateways.
Check object storage latency.
Increase cache.
Review compactor backlog.
Why it matters
Predictive anomaly detection changes operations from:
React after customer impactto:
Intervene before customer impactThat is the core SRE value.
4. Natural-language querying
What it means
Natural-language querying allows engineers to ask operational questions in plain English instead of writing PromQL, LogQL, TraceQL, SQL or Elasticsearch queries manually.
Example:
Show me p95 latency for checkout-api over the last 6 hours,
split by Kubernetes namespace.
The AI converts that into the right query.
Traditional workflow
You need to know the query language:
histogram_quantile(
  0.95,
  sum by (le, namespace) (
    rate(http_request_duration_seconds_bucket{
      service="checkout-api"
    }[5m])
  )
)
With natural-language querying:
What is checkout-api p95 latency by namespace for the last 6 hours?The AI generates and executes the query.
Where this is useful
Natural-language querying is useful across:
Metrics:
- Prometheus
- Mimir
- Thanos
- VictoriaMetrics

Logs:
- Loki
- Elasticsearch/OpenSearch
- ClickHouse

Traces:
- Tempo
- Jaeger
- OpenTelemetry backends

Databases:
- PostgreSQL
- BigQuery
- Snowflake
- ClickHouse

Cloud APIs:
- Kubernetes
- AWS
- Azure
- GCP
- OpenStack
Example questions
Which services had the largest increase in error rate in the last hour?

Show me pods that restarted after the latest deployment.

Find logs for payment-api where timeout errors increased.

Which traces spent the most time waiting on PostgreSQL?

Which Kubernetes nodes have high network retransmits?

Show me Ceph OSDs with rising latency and degraded placement groups.

Which GPU nodes show ECC errors or thermal throttling?
The important part: semantic mapping
Natural-language querying is not just text-to-query.
It needs to understand your telemetry naming.
For example, you may ask:
Show API latency.But your metrics may be called:
http_request_duration_seconds_bucket
nginx_ingress_controller_request_duration_seconds_bucket
istio_request_duration_milliseconds_bucket
app_http_server_duration_bucket
The AI needs a semantic layer that maps human concepts to real telemetry.
Good natural-language querying needs
Metric catalogue
Label documentation
Service ownership map
Namespace conventions
Dashboard metadata
Runbook links
Known-good query examples
SLO definitions
Deployment metadata
Without that, the AI may generate syntactically valid but operationally useless queries.
Risk: hallucinated queries
Natural-language querying can be dangerous if it invents metric names.
Bad output:
rate(checkout_latency_seconds[5m])But that metric may not exist.
Better behaviour:
I could not find a metric named checkout_latency_seconds.
I found http_request_duration_seconds_bucket with service="checkout-api".
Using that instead.
The AI should verify queries against the actual telemetry backend.
SRE impact
SREs will still need to understand PromQL, LogQL and traces, but less time will be spent manually composing queries.
The valuable skill becomes designing the semantic layer:
Good metric names
Useful labels
Consistent service metadata
Accurate ownership data
Clear runbooks
Well-documented SLOs
5. Knowledge-graph reasoning
What it means
Knowledge-graph reasoning connects operational facts into a graph so AI can reason over relationships.
Traditional observability stores data like this:
Metric:
checkout-api p95 latency = 2.1s

Log:
timeout connecting to postgres

Trace:
checkout-api → postgres took 1.8s

Kubernetes:
postgres pod moved to node-12

Infrastructure:
node-12 has disk pressure
A knowledge graph connects those facts:
checkout-api
   depends_on → postgres
   runs_in → namespace prod
   owned_by → payments-team

postgres
   runs_on → node-12
   uses → ceph-rbd-volume-44

node-12
   has_condition → disk_pressure

ceph-rbd-volume-44
   backed_by → ceph-pool-prod
Now the AI can reason across relationships.
Why graphs matter
Most incidents are not isolated.
They involve chains:
Application → runtime → Kubernetes → node → network → storage → hardwareDashboards show symptoms. Graphs show relationships.
Example graph
Customer impact
   ↑
checkout-api latency
   ↑
postgres query latency
   ↑
RBD volume latency
   ↑
Ceph OSD slow ops
   ↑
failing NVMe device
A graph-based system can move up and down this chain.
What goes into the graph
A strong observability knowledge graph includes:
Services
APIs
Databases
Queues
Kubernetes namespaces
Pods
Nodes
Clusters
Storage volumes
Ceph pools
Network devices
Load balancers
Ingress controllers
Deployments
Git commits
Feature flags
SLOs
Alerts
Incidents
Runbooks
Owners
Escalation paths
Cloud resources
OpenStack projects
GPU nodes
Training jobs
How the graph is built
Data sources may include:
Kubernetes API
Prometheus/Mimir labels
OpenTelemetry resource attributes
Service mesh telemetry
CMDB
Terraform state
GitOps repositories
CI/CD systems
Incident management tools
Cloud APIs
OpenStack APIs
Ceph APIs
Network controllers
Runbooks and docs
The graph is continuously updated.
Example reasoning
Question:
Why are training jobs slower on rack 3?The graph helps the AI discover:
Training-job-982
   runs_on → gpu-node-31, gpu-node-32, gpu-node-33
   located_in → rack-3
   uses_network → leaf-switch-3a
   uses_storage → lustre-client
   depends_on → metadata-server-2
Telemetry shows:
leaf-switch-3a has rising packet drops
NCCL retries increased
GPU utilisation has sawtooth pattern
training step time increased
AI conclusion:
The training slowdown is likely caused by network instability on rack 3,
not by GPU compute saturation.
That is knowledge-graph reasoning.
Why this matters for AI data centres
AI/HPC environments are dependency-heavy.
A single training workload may depend on:
GPU health
GPU memory
NVLink/NVSwitch
PCIe
RoCE/InfiniBand
Leaf-spine network
Storage bandwidth
Metadata servers
Container runtime
Kubernetes scheduler
Slurm scheduler
Image registry
Secrets
DNS
Authentication
Object storage
A flat dashboard cannot represent that well. A graph can.
6. Automated remediation
What it means
Automated remediation is when the system not only detects and diagnoses an issue, but also takes corrective action.
This is the most powerful and most dangerous part of AI-era observability.
It moves from:
Observe → Alert → Human fixesto:
Observe → Diagnose → Decide → Act → VerifySimple automated remediation
Low-risk examples:
Restart a failed pod.
Scale a deployment from 3 to 5 replicas.
Clear a stuck job.
Rotate a saturated log file.
Drain a bad Kubernetes node.
Open an incident ticket.
Create a Slack/PagerDuty summary.
Rollback a known-bad deployment.
Increase queue consumers.
Advanced automated remediation
Higher-risk examples:
Move workloads away from degraded storage.
Change Ceph recovery/backfill settings.
Disable a feature flag.
Rebalance Kafka partitions.
Quarantine a GPU node.
Remove a bad node from a load balancer.
Apply a network policy change.
Trigger disaster recovery failover.
Patch a vulnerable service.
These require stronger guardrails.
The remediation loop
A safe remediation system should work like this:
1. Detect
   Something abnormal happened.

2. Diagnose
   Determine probable cause and confidence.

3. Propose
   Generate a remediation plan.

4. Check policy
   Is this action allowed?
   Is the blast radius acceptable?
   Is approval required?

5. Act
   Execute the change.

6. Verify
   Did the metric improve?
   Did errors reduce?
   Did customer impact stop?

7. Roll back
   If not improved, revert or escalate.

8. Learn
   Record the incident and outcome.
Example
Issue:
checkout-api error rate increased after deployment.AI investigation:
New version deployed at 09:03.
Errors began at 09:05.
Only pods running version v2.7.4 are affected.
Previous version v2.7.3 had no errors.
Remediation proposal:
Rollback checkout-api from v2.7.4 to v2.7.3.Policy check:
Allowed because:
- service has rollback automation
- error rate exceeds SLO threshold
- last known-good version exists
- no database migration detected
Action:
kubectl rollout undo deployment/checkout-apiVerification:
Error rate returned to baseline after 4 minutes.
p95 latency returned to normal.
Incident summary created.
Guardrails are essential
Automated remediation must not be a reckless agent with production write access.
Good guardrails include:
Read-only by default
Approval required for high-risk actions
Change windows
Blast-radius limits
Dry-run mode
Policy-as-code
RBAC
Audit logs
Rollback plans
Rate limits
Canary execution
Human confirmation for destructive actions
For example:
Allowed automatically:
- restart one unhealthy pod
- scale a stateless service within limits
- create an incident ticket

Requires approval:
- drain production node
- rollback payment service
- modify firewall/network policy
- change Ceph recovery settings
- fail over database
How these six areas fit together
They are not separate ideas. They form a pipeline.
Natural-language querying
        ↓
Lets humans ask better questions

AI-assisted investigations
        ↓
Gathers evidence automatically

Knowledge-graph reasoning
        ↓
Understands relationships and dependencies

Automated root-cause analysis
        ↓
Identifies probable initiating cause

Predictive anomaly detection
        ↓
Finds issues before they become incidents

Automated remediation
        ↓
Fixes or mitigates the issue
A mature AI observability platform combines all six.
Practical architecture for an AI observability platform
A realistic architecture could look like this:
Telemetry sources
  ├─ Prometheus / Mimir metrics
  ├─ Loki logs
  ├─ Tempo traces
  ├─ Kubernetes events
  ├─ Ceph / storage metrics
  ├─ GPU metrics
  ├─ Network telemetry
  ├─ CI/CD events
  ├─ Git commits
  └─ Incident history

        ↓

Data normalization layer
  ├─ OpenTelemetry attributes
  ├─ Service naming standards
  ├─ Environment labels
  ├─ Owner/team labels
  └─ SLO metadata

        ↓

Context layer
  ├─ Runbooks
  ├─ Architecture docs
  ├─ Past incidents
  ├─ Known failure modes
  ├─ Deployment history
  └─ Dependency maps

        ↓

AI reasoning layer
  ├─ LLM
  ├─ RAG over runbooks/docs
  ├─ Query generation
  ├─ Anomaly detection
  ├─ Causal graph reasoning
  └─ RCA ranking

        ↓

Action layer
  ├─ Human-readable incident summary
  ├─ Suggested next steps
  ├─ Ticket creation
  ├─ Slack/PagerDuty update
  ├─ Safe automation
  └─ Approved remediation
What you would build first as an SRE
I would not start with fully automated remediation. That is too risky.
The sensible maturity path is:
Stage 1: AI-assisted read-only investigation
Build a tool that can answer:
What changed?
What alerts fired?
What services are affected?
What logs are unusual?
What traces are slow?
What runbook applies?
No write actions.
Stage 2: Natural-language query assistant
Allow engineers to ask:
Show me p95 latency by service.
Find logs for this incident window.
Show me failed pods after the deployment.
Compare today’s error rate with yesterday.
The assistant should show the generated query so the engineer can verify it.
Stage 3: Incident summariser
Generate structured summaries:
Incident:
Impact:
Start time:
Affected services:
Probable cause:
Evidence:
Actions taken:
Current status:
Recommended next steps:
This alone saves huge operational time.
Stage 4: RCA recommendation engine
Add correlation with:
Deployments
Kubernetes events
Node health
Storage health
Network telemetry
Recent config changes
Output probable root cause with confidence.
Stage 5: Predictive alerting
Start with safer predictions:
Disk will fill.
Object storage usage will exceed budget.
Kafka lag will breach SLO.
Ceph pool will hit near-full.
Certificate will expire.
GPU nodes are showing increasing ECC errors.
Stage 6: Human-approved remediation
The AI proposes actions, but humans approve.
Example:
Recommended action:
Drain node gpu-17 and reschedule workloads.

Reason:
GPU ECC errors increased and training retries are affecting jobs.

Approval required:
Yes.
Stage 7: Limited automatic remediation
Only allow automation for narrow, reversible, low-risk actions.
Restart crashed pod
Scale stateless deployment
Reopen failed consumer
Create incident ticket
Disable noisy alert temporarily with expiry
Main risks
AI observability can go wrong if the system has poor telemetry or too much authority.
1. Bad telemetry in, bad reasoning out
If labels are inconsistent, traces are incomplete, or logs are unstructured, AI conclusions will be weak.
2. Hallucinated root cause
The AI may sound confident while being wrong.
Always require:
Evidence
Confidence
Alternative theories
Query links
Raw data references
3. Unsafe remediation
A bad automated action can make an incident worse.
Example:
AI sees high memory.
AI restarts all pods.
All pods restart at once.
Outage gets worse.
That is why blast-radius control matters.
4. Hidden cost explosion
AI investigation can generate expensive backend queries.
A poorly controlled AI assistant may run huge queries across logs, traces and metrics.
You need:
Query limits
Timeouts
Caching
Sampling
Tenant controls
Cost visibility
5. Security and access control
The AI should not see or do everything.
It needs RBAC:
Read-only access for most users
Sensitive log masking
No secret exposure
Audit trail
Approval for write actions
Tenant isolation
The big picture
These six capabilities are the future of observability:
| Capability | Main purpose | Human role |
|---|---|---|
| AI-assisted investigations | Speed up incident analysis | Validate findings |
| Automated RCA | Identify probable cause | Judge evidence |
| Predictive anomaly detection | Prevent incidents earlier | Tune models and thresholds |
| Natural-language querying | Make telemetry easier to access | Verify generated queries |
| Knowledge-graph reasoning | Understand system relationships | Maintain accurate topology |
| Automated remediation | Fix or mitigate issues | Define guardrails and approve risk |
The core change is this:
Observability is no longer just about collecting telemetry.

It is becoming a reasoning system over telemetry.
For SREs, the opportunity is to become the person who builds and governs that reasoning system: telemetry quality, context, automation safety, incident workflows, and trust boundaries.
Commercial AI Observability
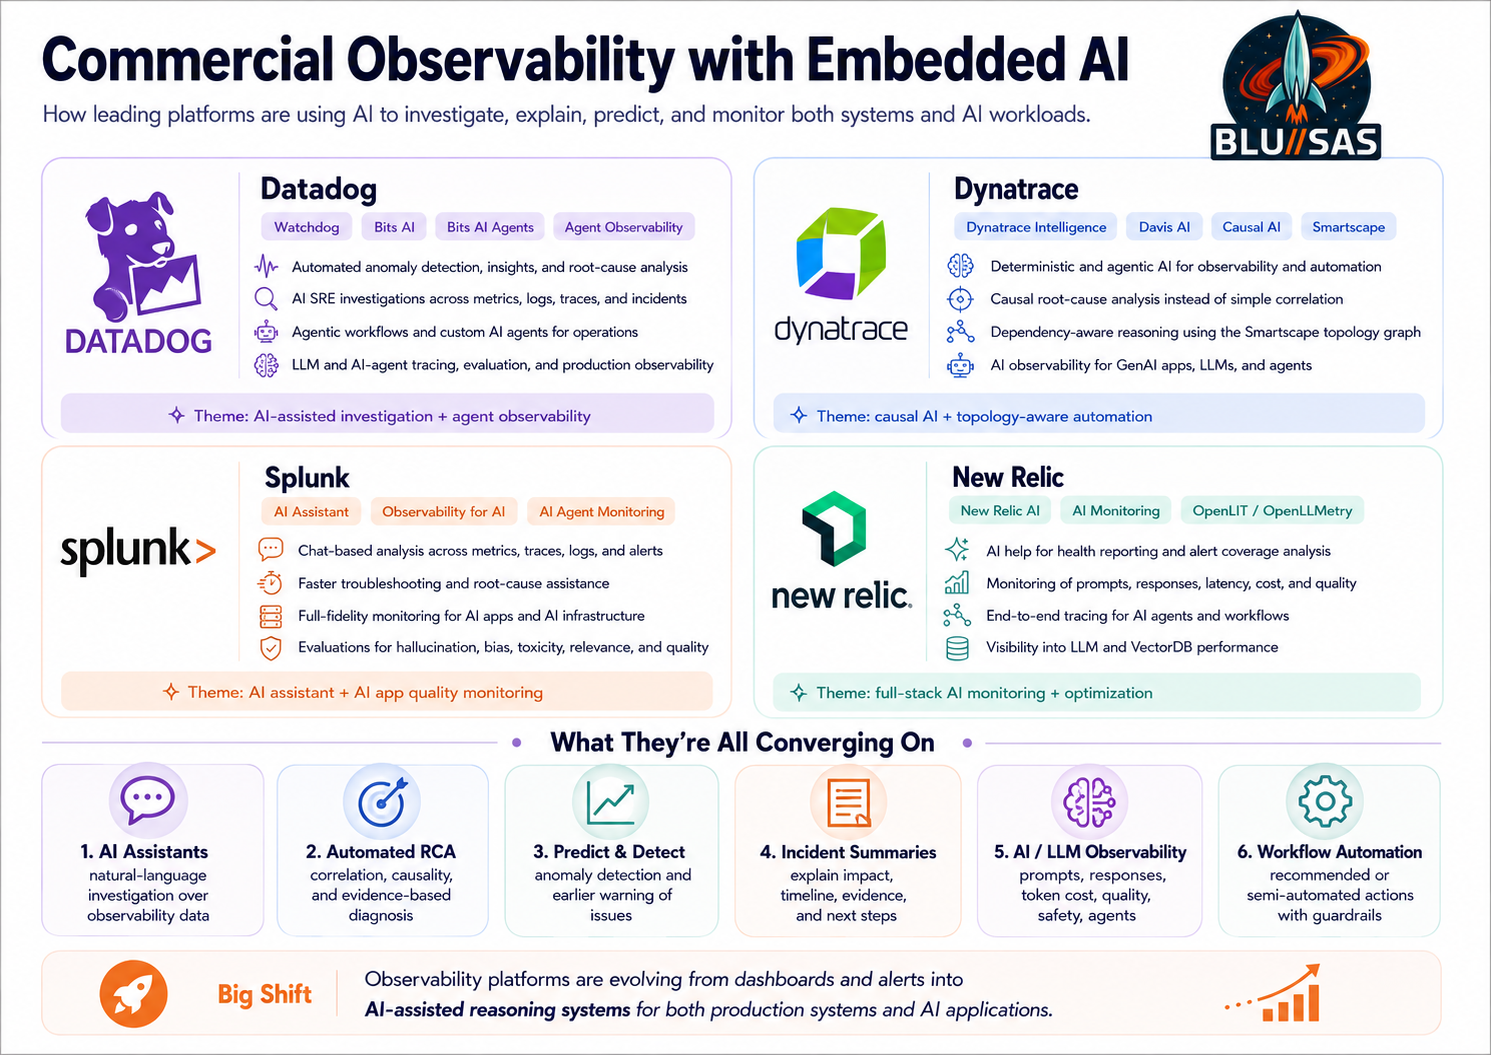
Commercial companies are building AI into observability in two directions:
- AI for observability — using AI to investigate, correlate, explain, predict and remediate production issues.
- Observability for AI — monitoring LLMs, agents, RAG pipelines, vector databases, model quality, hallucinations, token cost, latency, drift and safety.
So the product shift is not just “add a chatbot to dashboards.” The bigger move is toward an AI operations layer that sits above metrics, logs, traces, events, topology and runbooks.
Telemetry + topology + deployments + logs + traces + incidents + runbooks
                                ↓
                       AI reasoning layer
                                ↓
     Explain issue → find cause → predict risk → recommend/execute action
1. Datadog
Datadog is building AI into its platform around Bits AI, Watchdog, and LLM/Agent Observability.
Datadog’s Watchdog is its AI engine for automated alerts, insights and root-cause analysis across Datadog telemetry. It continuously monitors infrastructure and surfaces important signals to help teams detect, troubleshoot and resolve issues.
Datadog’s Bits AI SRE is positioned as an always-on AI SRE agent that helps handle troubleshooting and alerts, with Datadog describing it as able to pinpoint root causes faster by using Datadog’s incident and telemetry context.
Datadog is also pushing Bits AI Agents and Agent Builder, where the platform can build custom AI agents that investigate issues, make decisions and take action using Datadog and third-party data, with prebuilt actions across cloud, security, CI/CD and collaboration tooling.
For the second direction, Datadog has Agent Observability / LLM Observability, aimed at tracing, evaluating and improving LLM-powered applications and AI agents. Datadog says each LLM application request can be represented as a trace, allowing teams to investigate root cause, operational performance, quality, privacy and safety.
In plain SRE terms, Datadog is building:
Datadog AI direction:

Watchdog
  → automatic anomaly detection
  → automated insights
  → RCA suggestions

Bits AI
  → natural-language investigation
  → AI SRE assistant
  → incident summarisation
  → workflow automation

Bits AI Agents
  → custom agentic workflows
  → investigation agents
  → remediation/documentation agents

LLM / Agent Observability
  → traces for LLM calls
  → prompt/response monitoring
  → quality, privacy, safety checks
  → AI-agent debugging
Datadog is also doing deeper model work: its Toto time-series foundation model is specifically designed for observability time-series forecasting and was trained partly on Datadog observability data.
2. Dynatrace
Dynatrace has probably been the most explicit about putting causal AI at the centre of observability.
Its AI engine is Davis AI / Dynatrace Intelligence. Dynatrace describes its AI approach as combining predictive AI, causal AI and generative AI over unified observability and security data to automate workflows.
Dynatrace’s key differentiator is that it does not want the AI to merely correlate metrics. It wants the platform to understand causality: what caused what, what depends on what, and what failure actually triggered the incident. Dynatrace describes causal AI as using causal and deterministic techniques to determine underlying causes and effects rather than just relying on correlation.
Dynatrace also presents Dynatrace Intelligence as combining deterministic insights with agentic action for prevention, remediation and optimisation at scale.
For AI workloads, Dynatrace has AI and LLM Observability for monitoring, optimising and securing generative AI apps, LLMs and agentic workflows, with emphasis on performance, explainability and compliance.
In SRE terms, Dynatrace is building:
Dynatrace AI direction:

Davis AI / Dynatrace Intelligence
  → anomaly detection
  → causal root-cause analysis
  → topology-aware problem detection
  → predictive risk detection
  → generative explanations
  → workflow automation

Causal AI
  → dependency-aware analysis
  → fault-tree-style reasoning
  → root cause, not just symptom correlation

AI and LLM Observability
  → GenAI app monitoring
  → LLM and agentic workflow visibility
  → explainability
  → compliance-oriented monitoring
The important point: Dynatrace is trying to make observability less like “search through telemetry” and more like automated dependency-aware diagnosis.
3. Splunk
Splunk is building AI into observability through Splunk AI Assistant in Observability Cloud, broader AI Observability, and AI/agent monitoring.
Splunk’s AI Assistant in Observability Cloud uses observability data from metrics, traces, logs and alerts through a chat interface inside Splunk Observability Cloud.
Splunk says the AI Assistant can analyze data across APM, Infrastructure Monitoring, Database Monitoring, RUM and log analytics to help with root-cause analysis.
Splunk is also building “observability for AI” capabilities. Its Splunk Observability for AI is described as full-fidelity monitoring and troubleshooting across AI applications and the AI infrastructure components used to build them.
Splunk’s AI Agent Monitoring aims to correlate degraded AI agent/model performance and track operational metrics such as latency and errors alongside quality/security metrics such as hallucinations, bias, drift, accuracy, cost and token usage.
Splunk’s AI Observability positioning is broader: observe and optimise performance, quality, cost and security across agents, LLMs, vector databases and infrastructure.
In SRE terms, Splunk is building:
Splunk AI direction:

AI Assistant in Observability Cloud
  → natural-language investigations
  → logs + metrics + traces + alerts analysis
  → RCA assistance
  → incident summarisation

AI Observability
  → AI application monitoring
  → AI infrastructure monitoring
  → agent performance tracking
  → LLM quality and safety monitoring

AI Agent Monitoring
  → latency and errors
  → hallucination tracking
  → bias/drift/accuracy
  → token and cost visibility
  → model and agent reliability
Splunk’s direction is very aligned with its historical strength: search, correlation and operational analytics, now wrapped in AI-assisted investigation and AI workload monitoring.
4. New Relic
New Relic is building AI into its platform through New Relic AI, AI-powered observability features, and AI Monitoring / LLM observability.
New Relic says New Relic AI can help instrument systems, generate system health reports and identify alert coverage gaps for full-stack observability.
New Relic has also positioned its platform as AI-powered observability that correlates telemetry across the stack to isolate root cause and reduce operational toil.
For LLM applications, New Relic AI monitoring captures telemetry from AI-powered apps through APM agents and collects data from external LLMs and vector stores.
New Relic’s AI monitoring focuses on troubleshooting, comparing and optimising LLM prompts and responses for performance, cost and quality issues such as hallucination, bias and toxicity.
It also supports LLM observability through OpenLIT integration, which automatically generates traces and metrics for LLM and VectorDB performance and cost analysis.
In SRE terms, New Relic is building:
New Relic AI direction:

New Relic AI
  → AI assistant for DevOps
  → system health reports
  → alert coverage analysis
  → instrumentation help

AI-powered observability
  → telemetry correlation
  → root-cause isolation
  → faster troubleshooting

AI Monitoring / LLM Observability
  → prompt/response analysis
  → LLM latency and error tracking
  → cost analysis
  → hallucination, bias and toxicity signals
  → VectorDB visibility
New Relic’s direction is about making its “all-in-one observability” platform more assistant-driven and making AI workloads first-class observable systems.
What they are all converging on
All four vendors are converging on the same broad architecture:
1. Collect telemetry
   metrics, logs, traces, events, profiles, topology

2. Normalize context
   services, owners, deployments, dependencies, SLOs, runbooks

3. Apply AI
   anomaly detection, query generation, summarisation, RCA, prediction

4. Explain
   what happened, why it happened, what changed, what is affected

5. Act
   create ticket, page team, suggest fix, trigger workflow, remediate safely

6. Observe AI itself
   LLM calls, prompts, responses, token cost, model quality, hallucinations,
   safety, drift, vector DBs, RAG pipelines, agent workflows
The big product categories are:
| AI capability | What vendors are building |
|---|---|
| AI assistant | Chat interface over observability data |
| AI SRE agent | Investigates incidents and proposes actions |
| Automated RCA | Finds likely root cause using telemetry and topology |
| Predictive anomaly detection | Spots problems before thresholds are breached |
| Natural-language querying | Converts plain English into PromQL, LogQL, SQL, trace/log queries |
| Incident summarisation | Explains impact, timeline, evidence and next steps |
| Runbook automation | Recommends or triggers operational workflows |
| AI workload monitoring | Monitors LLMs, agents, prompts, responses, cost and quality |
| Governance/safety | Tracks hallucination, toxicity, bias, privacy and compliance risks |
| Cost optimisation | Reduces telemetry waste and tracks LLM/token spend |
The strategic reason they are doing this
The observability market is under pressure from three directions.
First, telemetry volumes are exploding. Kubernetes, microservices, edge, GPU clusters, AI workloads and distributed storage produce far more telemetry than humans can manually inspect.
Second, SRE teams are overloaded. Vendors are trying to sell “lower MTTR” and “less operational toil” by making the platform do more triage and correlation automatically.
Third, AI applications create new observability requirements. Traditional APM can tell you latency and error rate, but AI systems also need visibility into prompts, responses, hallucinations, drift, token usage, model quality, RAG retrieval quality, vector database behaviour and agent decisions.
So vendors are not just adding AI because it is fashionable. They are defending and expanding their core observability business.
What this means for an SRE / Observability Platform Engineer
The skill shift is significant.
Old value:
Build dashboards.
Write alert rules.
Know PromQL and LogQL.
Search logs manually.
Correlate incidents by experience.
New value:
Design telemetry that AI can reason over.
Standardise labels and service metadata.
Maintain accurate topology and ownership maps.
Connect observability to deployment and incident data.
Create safe remediation workflows.
Validate AI-generated RCA.
Control cost, access and blast radius.
The winners will not simply be the engineers who know the most dashboards. The winners will be the engineers who can build a trusted operational intelligence layer over metrics, logs, traces, topology and automation.
AI Strategies of New Observability Products
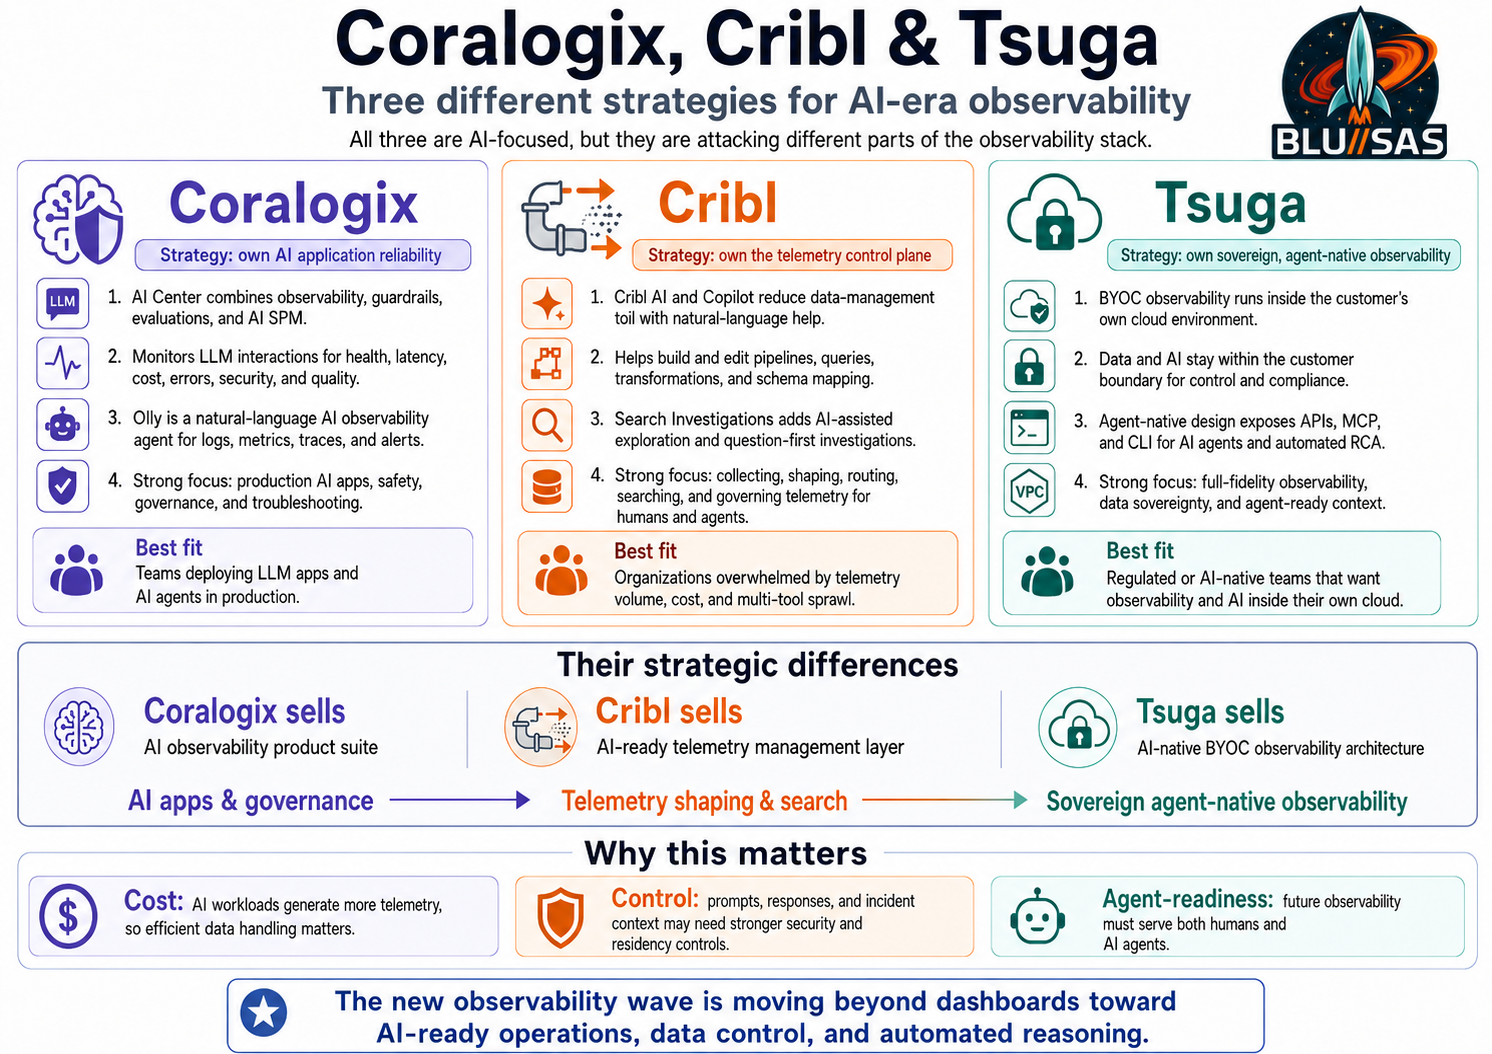
Coralogix is releasing the most explicit “AI observability product suite.” Cribl is positioning itself as the telemetry data layer for AI-era observability. Tsuga is newer and appears to be building an AI-native, bring-your-own-cloud observability architecture rather than simply adding an AI assistant to an old SaaS model.
Quick comparison
| Company | AI direction | Product maturity from public material |
|---|---|---|
| Coralogix | AI Center, AI guardrails, AI evaluations, AI-SPM, Olly AI observability agent | Very explicit productised AI offering |
| Cribl | Cribl AI, Copilot, AI-guided Search Investigations, telemetry for humans and agents | Strong AI-assisted telemetry/data-management direction |
| Tsuga | BYOC observability for the AI era, agent-native observability, MCP/CLI for customer-owned agents | Newer; more architectural and agent-native positioning |
1. Coralogix: AI observability as a full product suite
Coralogix is clearly releasing AI-focused products. Its main AI platform is AI Center, which Coralogix describes as a complete platform for AI-powered applications combining observability, guardrails, evaluations, and AI Security Posture Management in one place. It monitors LLM interactions for health, performance, cost, latency, errors, security and quality issues.
The key Coralogix AI products are:
Coralogix AI Center
  ├─ AI Observability
  ├─ AI Guardrails
  ├─ AI Evaluations
  ├─ AI Security Posture Management
  ├─ AI Application Discovery
  └─ AI Explorer / Application Drilldown
What Coralogix is targeting
Coralogix is not just monitoring servers. It is monitoring AI application behaviour:
Prompt
  ↓
LLM call
  ↓
Response
  ↓
Evaluation
  ↓
Guardrail decision
  ↓
Security / quality / cost signal
Its AI Center monitoring gives an organisation-level view of LLM usage and lets teams drill from a trend down to a specific application and even a specific prompt/response interaction.
It also supports OpenTelemetry GenAI semantic conventions, so teams can send GenAI spans into Coralogix AI Center without needing a Coralogix-specific SDK.
Olly: Coralogix’s AI observability agent
Coralogix also has Olly, which it describes as an AI-native observability agent. Olly lets users ask natural-language questions and get answers across logs, metrics, traces and alerts.
In practice, this is the “AI SRE assistant” layer:
Human asks:
“Why is payment latency rising?”

Olly checks:
  ├─ logs
  ├─ metrics
  ├─ traces
  ├─ alerts
  ├─ correlations
  └─ possible root causes

Then returns:
  ├─ explanation
  ├─ evidence
  ├─ affected services
  └─ recommended next steps
Coralogix also positions Olly as more than a simple assistant: it says Olly uses specialised agents for log analysis, trace exploration, metrics interpretation, security research, code debugging, correlation analysis and hypothesis generation.
My read on Coralogix
Coralogix is trying to own AI production reliability:
Monitor AI apps
Evaluate AI outputs
Detect prompt injection / PII / toxicity
Track token cost
Find bad model behaviour
Use AI to investigate normal production incidents
So yes: Coralogix is strongly AI-focused.
2. Cribl: AI platform for telemetry, not classic dashboard observability
Cribl’s AI angle is different. Cribl is not primarily trying to be another Datadog-style full-stack UI. It is positioning itself as the AI Platform for Telemetry: the collection, routing, shaping, searching and governance layer for machine data used by humans and AI agents. Cribl’s homepage describes the platform as giving enterprises choice and control for telemetry, and says it helps manage and analyse telemetry for both humans and agents.
The AI-focused Cribl areas are:
Cribl AI
  ├─ Copilot
  ├─ Copilot Editor
  ├─ AI-guided Search Investigations
  ├─ Natural-language queries
  ├─ AI-assisted pipeline creation
  ├─ AI telemetry parsing
  └─ AI-ready telemetry routing
Cribl AI and Copilot
Cribl says its AI capabilities help teams create and modify pipelines, queries and configurations using natural language. It also says Cribl Copilot provides troubleshooting guidance, answers product/configuration questions and helps teams resolve issues faster.
This matters because a lot of observability toil is not just dashboards. It is:
Parse this log format.
Map this schema.
Route this data.
Drop this noisy field.
Mask this sensitive value.
Send this stream to the SIEM.
Send this other stream to cheaper storage.
Cribl’s AI is aimed at reducing that data-engineering toil.
Copilot Editor
Cribl’s Copilot Editor uses AI to help with schema mapping, translating logs across systems and building telemetry pipelines that clean, filter and route events.
That is important because AI-era observability needs clean, standardised telemetry. A reasoning agent is only useful if the data has usable structure.
Raw logs
  ↓
AI-assisted parsing
  ↓
Schema mapping
  ↓
Enrichment / masking / routing
  ↓
Search / SIEM / observability backend / AI agent
AI-guided Cribl Search Investigations
Cribl Search has an Investigations feature in preview. The docs describe it as a guided workspace where users explore incidents and telemetry using natural-language prompts. It helps analyse telemetry, identify patterns and document findings without manually building every query.
That means Cribl is moving into the AI-assisted investigation workflow:
Alert or question
  ↓
Natural-language investigation
  ↓
Generated queries
  ↓
Pattern discovery
  ↓
Findings captured in one workspace
Cribl’s AI observability thesis
Cribl’s recent AI observability messaging is that AI observability is a telemetry problem, not just a dashboard problem. It argues that LLM apps generate prompts, completions, tool calls, retrieval steps, token counts, model choices, policy events and infrastructure signals, and that those need to be collected and shaped for different teams and tools.
My read on Cribl
Cribl is not saying:
“We are the AI RCA dashboard.”It is saying:
“We are the telemetry control plane that makes AI investigations possible.”That is strategically clever. AI agents need cheap, governed, high-quality access to large telemetry volumes. Cribl wants to be the pipe, filter, schema and search layer underneath that.
3. Tsuga: AI-native observability architecture, still early
Tsuga is the newest and least mature publicly compared with Coralogix and Cribl, but it is very clearly positioning itself around the AI-era observability problem.
Tsuga describes itself as a bring-your-own-cloud observability platform for logs, metrics, traces and APM, deployed inside the customer’s AWS account using infrastructure-as-code. It says customers get the control of self-hosted infrastructure without the operational burden of running it.
Its newer positioning is explicitly AI-era focused. Tsuga announced a $35 million Series A on June 23, 2026, saying it is building “observability for the AI era” inside the customer’s cloud so the customer’s data and AI do not leave their control.
Tsuga’s AI claim
Tsuga’s argument is architectural:
Traditional observability:
  telemetry leaves your cloud
  vendor stores it
  cost rises with volume
  AI agents require broad access to vendor-hosted data

Tsuga model:
  observability runs inside your cloud
  telemetry stays inside your perimeter
  AI runs on your own data
  agents can use complete telemetry without exporting sensitive context
Tsuga says its AI tools run on the customer’s data inside the customer’s perimeter. It also says automated root-cause analysis runs on complete, unsampled data, and that its MCP server and CLI let engineering teams build their own agents on that foundation inside their own security boundary.
That MCP point is important. It suggests Tsuga is not only building an observability UI; it is exposing observability context to AI agents.
Agent-native observability
Tsuga has a specific Agent-Native Observability page. It says Tsuga is built so AI agents can use observability data effectively, affordably and inside the customer environment. It highlights agent-first APIs, MCPs, CLIs and query interfaces designed to return relevant context rather than raw data dumps.
That is a very modern product angle.
AI agent asks:
“What changed before this incident?”

Tsuga should return:
  ├─ relevant metrics
  ├─ relevant logs
  ├─ deployment context
  ├─ service ownership
  ├─ topology
  └─ probable causal evidence

Not:
  └─ 10GB of raw logs
What is less clear with Tsuga
Publicly, Tsuga looks less like:
Named AI assistant with lots of screenshots and feature modulesand more like:
AI-native observability architecture:
  BYOC
  complete telemetry
  agent APIs
  MCP
  automated RCA
  customer-owned AI boundary
So my assessment is: yes, Tsuga is AI-focused, but the public product story is currently more architectural and agent-native than feature-by-feature like Coralogix.
The strategic differences
Coralogix: “Observe and govern AI applications”
Coralogix is focused on production AI application reliability:
LLM monitoring
AI guardrails
Evaluations
AI security posture
Prompt/response visibility
Olly AI investigation agent
Best fit:
Teams deploying LLM apps and agents who need monitoring, safety, cost tracking and AI-assisted troubleshooting.Cribl: “Prepare and control telemetry for AI”
Cribl is focused on the telemetry substrate:
Collect once
Shape data
Mask sensitive fields
Route anywhere
Search cheaply
Let humans and agents investigate
Use AI to build pipelines and queries
Best fit:
Large enterprises drowning in telemetry volume, SIEM costs, log routing complexity and multi-tool data sprawl.Tsuga: “Run AI-era observability inside your own cloud”
Tsuga is focused on sovereign, cost-controlled, agent-native observability:
BYOC deployment
Telemetry stays in your cloud
AI and agents run inside your boundary
Automated RCA on unsampled data
MCP/CLI for custom SRE agents
Best fit:
Regulated, European, AI-native or high-scale companies that do not want telemetry, prompts, incident history and operational context exported to a third-party SaaS cloud.The bigger market pattern
These newer players are attacking the incumbents from three angles:
1. Cost
   AI generates more telemetry.
   Per-GB SaaS observability becomes painful.

2. Data control
   AI telemetry includes prompts, responses, business context and security-sensitive data.
   Customers do not always want that in a vendor cloud.

3. Agent-readiness
   Future observability is not just dashboards for humans.
   AI agents need APIs, context retrieval, governed telemetry access and automated RCA.
So the new wave is less about “AI as a dashboard chatbot” and more about building the data foundation for AI-driven operations.
The sharpest summary is:
Coralogix = AI observability product suite
Cribl     = AI-ready telemetry control plane
Tsuga     = AI-native sovereign observability architecture
For an SRE/observability platform engineer, these companies are worth watching because they indicate where the next jobs and platform designs are going: telemetry engineering, AI-readable context, agent-safe access, automated RCA, guardrails and cost-controlled observability architectures.
Opensource AI Observability
AI adoption in open-source observability is happening, but it is different from what Datadog, Dynatrace, Splunk and New Relic are doing.
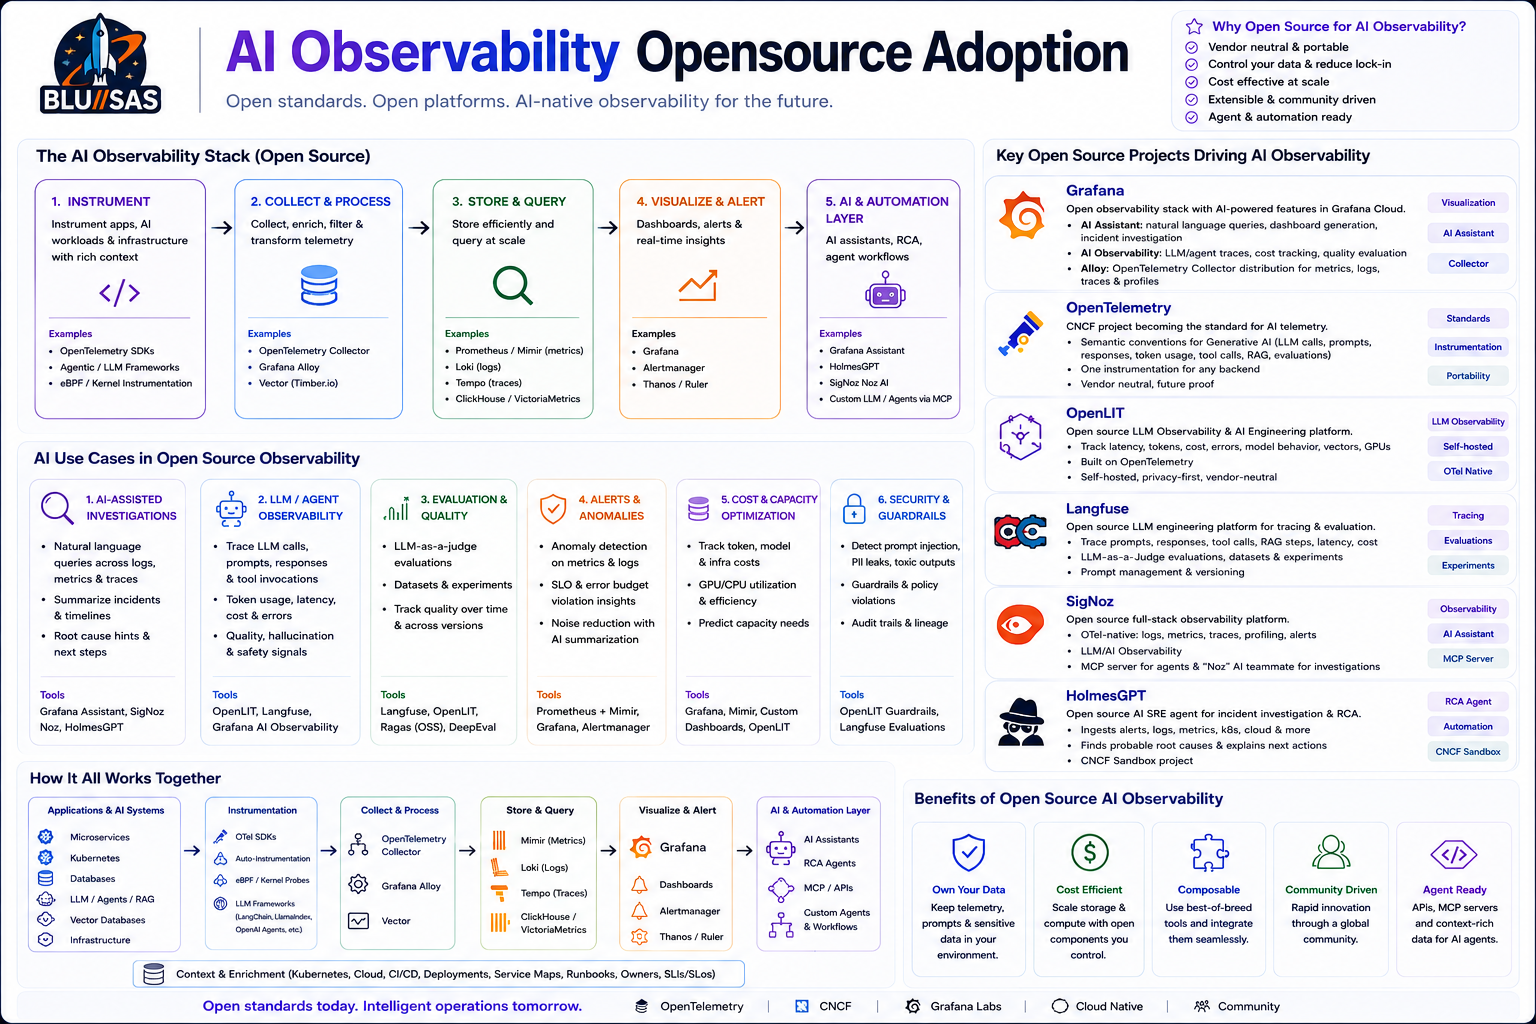
The commercial vendors are embedding AI directly into their SaaS platforms. The open-source ecosystem is mostly building the standards, collectors, SDKs, self-hostable platforms and agent interfaces that allow AI observability to work without vendor lock-in.
The big shift is this:
Old open-source observability:

Prometheus / Loki / Tempo / Grafana / OpenTelemetry
        ↓
Collect, store, query, dashboard, alert


AI-era open-source observability:

OpenTelemetry + collectors + traces + logs + metrics + AI metadata
        ↓
LLM / agent / RAG / GPU / vector DB visibility
        ↓
AI assistants, AI SRE agents, natural-language querying, RCA
1. Grafana: open observability stack + AI features around it
Grafana Labs is moving in two directions.
First, it is keeping the open observability stack relevant for AI-era workloads: Grafana, Loki, Mimir, Tempo, Pyroscope and Alloy remain the core telemetry stack.
Second, it is adding AI-powered layers on top, especially in Grafana Cloud.
Grafana’s AI Observability product is built on OpenTelemetry and is aimed at teams running LLM agents in production. It monitors agent activity, traces conversations, tracks costs and evaluates quality. Grafana documents SDK support for Go, Python, TypeScript, Java and .NET, plus integrations with frameworks such as LangChain, LangGraph, OpenAI Agents and Vercel AI SDK.
Grafana also has Grafana Assistant, an AI-powered observability agent. It lets users ask questions like “Show me CPU usage” or “Create a dashboard for my database,” and it works across metrics, logs, traces, profiles and databases. Grafana says it can run investigations, manage dashboards, build/refine queries and help users navigate Grafana resources.
The important nuance: Grafana Assistant is not the same thing as open-source Grafana itself. It is primarily a Grafana Cloud AI capability, though Grafana documents a self-managed Assistant app that connects to a Grafana Cloud stack with reduced functionality.
Grafana’s most open-source-relevant AI move is probably Grafana Alloy. Alloy is Grafana Labs’ open-source OpenTelemetry Collector distribution with built-in Prometheus pipelines and support for metrics, logs, traces and profiles. It gives Grafana a standard collector layer for AI-era telemetry pipelines.
So Grafana’s strategy is:
Grafana AI strategy:

Open-source base:
  Grafana
  Loki
  Mimir
  Tempo
  Pyroscope
  Alloy

AI observability:
  LLM / agent traces
  cost tracking
  quality evaluation
  AI workload dashboards

AI assistant:
  natural-language querying
  dashboard creation
  investigation assistance
  query generation

Strategic direction:
  keep the OSS stack open,
  but place high-value AI workflows in Grafana Cloud.
2. OpenTelemetry: the standard layer for AI observability
OpenTelemetry is not a company; it is a CNCF open-source project. Its role is different from Grafana’s.
OpenTelemetry is becoming the standard telemetry schema and instrumentation layer for AI systems.
OpenTelemetry describes itself as an open-source observability framework for cloud-native software, providing APIs, libraries, agents and collector services for capturing telemetry. It also emphasises vendor-neutral instrumentation, meaning you instrument once and export to different backends.
For AI, the key development is OpenTelemetry semantic conventions for generative AI. OpenTelemetry has been extending its conventions so GenAI telemetry can capture model parameters, response metadata, token usage, traces, metrics and events for model interactions.
That matters because LLM systems need new telemetry fields that normal web apps did not need:
Traditional app telemetry:
  service.name
  http.status_code
  duration
  error
  route
  database call

AI app telemetry:
  model name
  prompt
  completion
  token count
  tool call
  retrieval step
  vector DB query
  embedding model
  cost
  temperature
  hallucination score
  safety evaluation
OpenTelemetry is not trying to become an AI assistant. Its value is that it gives the ecosystem a common language for AI telemetry.
So OpenTelemetry’s strategy is:
OpenTelemetry AI strategy:

Standardise:
  spans
  metrics
  logs/events
  attributes
  semantic conventions

Support:
  LLM calls
  model interactions
  prompts/responses
  token usage
  latency
  errors
  provider metadata

Enable:
  Grafana
  SigNoz
  Langfuse
  OpenLIT
  Elastic
  New Relic
  Datadog
  custom platforms

Strategic direction:
  become the neutral telemetry contract for AI applications.
3. OpenLIT: open-source LLM observability on OpenTelemetry
OpenLIT is a good example of the new generation of open-source AI observability projects.
It describes itself as an open-source LLM observability and AI engineering platform built on OpenTelemetry. Its positioning is self-hosted, privacy-first and vendor-neutral.
This is important because many companies do not want prompts, responses, user inputs, sensitive data or AI-agent traces going straight into a third-party SaaS.
OpenLIT’s direction is:
OpenLIT strategy:

Monitor:
  LLM calls
  latency
  token usage
  cost
  model behaviour
  vector DBs
  GPU usage

Deploy:
  self-hosted
  OpenTelemetry-native
  privacy-first

Best fit:
  teams building AI apps who want open-source AI observability
  without committing to a commercial platform first.
4. Langfuse: open-source LLM tracing and evaluation
Langfuse is another major open-source AI observability project.
It focuses on LLM application tracing: capturing prompts, model responses, token usage, latency, tool calls and retrieval steps. Langfuse also provides AI-engineering features such as LLM-as-judge evaluation, prompt management, experiments and datasets, and it can be self-hosted.
Langfuse is less like “Grafana for all infrastructure” and more like “observability and evaluation for LLM applications.”
Its strategy is:
Langfuse strategy:

Trace:
  prompt
  response
  tool call
  RAG step
  latency
  token usage
  cost

Evaluate:
  quality
  scoring
  experiments
  prompt versions
  datasets

Best fit:
  AI product teams who need to debug and improve LLM apps,
  not just monitor infrastructure.
5. SigNoz: open-source observability with AI-agent access
SigNoz is moving from being an open-source Datadog/New Relic alternative into a more AI-aware observability platform.
SigNoz describes itself as an open-source observability tool powered by OpenTelemetry, covering logs, metrics, traces, dashboards, alerts and LLM/AI observability. It also advertises an MCP server for bringing telemetry into coding agents and an AI teammate called Noz for incident investigation, alert tuning and dashboard building.
This is significant because it shows a broader open-source pattern: observability platforms are not just adding AI dashboards; they are exposing telemetry to AI agents.
SigNoz direction:

OpenTelemetry-native observability
  +
LLM/AI observability
  +
MCP access for coding agents
  +
AI teammate for investigations and dashboards
That is where open-source observability is going: not just dashboards for humans, but context APIs for agents.
6. HolmesGPT: open-source AI SRE agent
HolmesGPT is another important example because it is not primarily about observing LLM apps. It is about using AI to investigate production incidents.
HolmesGPT describes itself as an open-source AI agent for investigating production incidents and finding root causes across Kubernetes, VMs, cloud providers, databases and SaaS platforms. It is listed as a CNCF sandbox project.
That puts it closer to the Datadog Bits AI / Dynatrace Davis AI direction, but in open-source form.
HolmesGPT strategy:

Input:
  alerts
  Kubernetes state
  metrics
  logs
  cloud context
  runbooks

AI task:
  investigate incident
  gather evidence
  find probable root cause
  explain next action

Best fit:
  platform teams wanting an open-source AI SRE layer
  over existing observability tools.
The overall open-source adoption pattern
Open-source observability is adopting AI in four layers.
1. AI telemetry standards
This is where OpenTelemetry is most important.
Goal:
  make AI applications observable in a standard way

Examples:
  GenAI semantic conventions
  token usage attributes
  model request spans
  prompt/response events
  tool-call spans
This is foundational. Without standard AI telemetry, every vendor and OSS project invents incompatible schemas.
2. AI workload observability
This is where Grafana AI Observability, OpenLIT, Langfuse and SigNoz fit.
Goal:
  monitor LLM apps, agents and RAG pipelines

Signals:
  latency
  token cost
  prompt/response quality
  hallucination risk
  model errors
  vector DB retrieval
  tool calls
  agent steps
3. AI-assisted operations
This is where Grafana Assistant, HolmesGPT, SigNoz Noz and similar tools fit.
Goal:
  help humans investigate production systems faster

Capabilities:
  natural-language querying
  alert explanation
  dashboard generation
  root-cause hints
  log summarisation
  incident summaries
4. Agent-native observability
This is the newest layer.
Goal:
  let AI agents consume observability data safely

Interfaces:
  MCP servers
  CLI tools
  API access
  context retrieval
  guarded query execution
  evidence-based RCA
This matters because future AI coding agents and SRE agents will need access to production telemetry to debug issues. The observability stack must become queryable by both humans and machines.
The key difference from commercial observability
Commercial vendors are building polished AI experiences inside their own SaaS platforms.
Open-source observability is building the portable foundations:
| Layer | Open-source approach |
|---|---|
| Instrumentation | OpenTelemetry SDKs and semantic conventions |
| Collection | OpenTelemetry Collector, Grafana Alloy |
| Storage/query | Grafana LGTM, SigNoz, ClickHouse-based stacks |
| AI app tracing | OpenLIT, Langfuse, OTel GenAI conventions |
| AI SRE | HolmesGPT, MCP-enabled tools |
| Agent access | MCP, APIs, CLI workflows |
The strategic difference is:
Commercial vendors:
  "Use our platform and our AI will help you."

Open-source ecosystem:
  "Instrument once, own your data, expose telemetry to any backend or AI agent."
What this means for SREs and observability engineers
The valuable skill is moving from only operating dashboards to building an AI-readable telemetry platform.
That means:
You need:
  consistent OpenTelemetry attributes
  clean service names
  good resource metadata
  deployment markers
  trace/log/metric correlation
  AI workload spans
  token/cost metrics
  evaluation signals
  MCP or API access for agents
  guardrails around sensitive telemetry
For a homelab or professional platform, the modern open-source direction would be:
Applications / AI agents
        ↓
OpenTelemetry SDKs + GenAI semantic conventions
        ↓
Grafana Alloy or OpenTelemetry Collector
        ↓
Mimir / Loki / Tempo / ClickHouse / SigNoz / Langfuse / OpenLIT
        ↓
Grafana dashboards + AI assistant / HolmesGPT / MCP-enabled agents
The sharp summary:
Grafana is making the open observability stack AI-aware.

OpenTelemetry is becoming the standard language for AI telemetry.

OpenLIT, Langfuse and SigNoz are making LLM apps observable.

HolmesGPT-style tools are turning open telemetry into AI-assisted SRE investigations.
So, yes: open-source observability is adopting AI quickly, but the centre of gravity is different. The open-source world is less about one vendor-owned AI brain and more about open telemetry, self-hostable AI observability, and agent-ready operations.